. 2017 Dec;58(9):632-643.
doi: 10.1002/em.22137. Epub 2017 Sep 25.

Comparing BMD-derived genotoxic potency estimations across variants of the transgenic rodent gene mutation assay

Affiliations

Comparing BMD-derived genotoxic potency estimations across variants of the transgenic rodent gene mutation assay

John W Wills et al. Environ Mol Mutagen. 2017 Dec.

Abstract

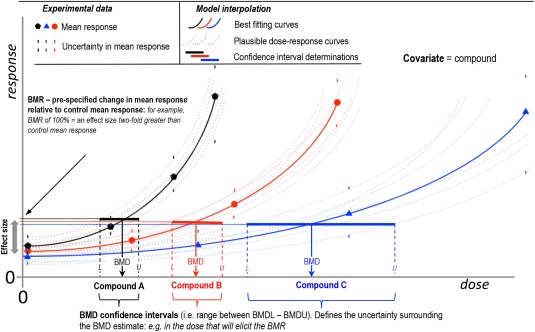
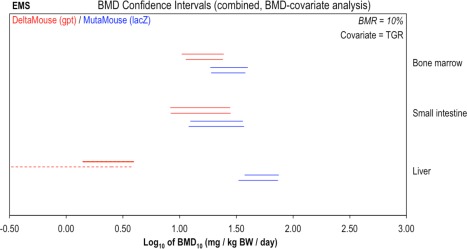
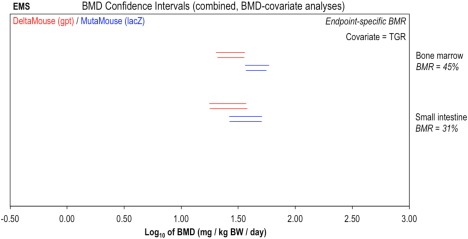
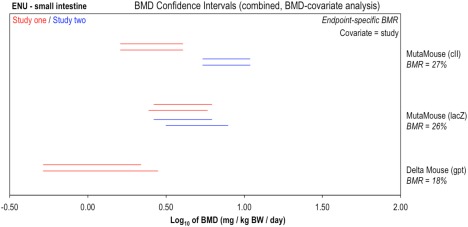
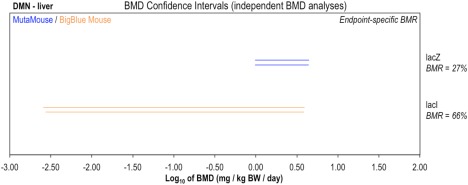
There is growing interest in quantitative analysis of in vivo genetic toxicity dose-response data, and use of point-of-departure (PoD) metrics such as the benchmark dose (BMD) for human health risk assessment (HHRA). Currently, multiple transgenic rodent (TGR) assay variants, employing different rodent strains and reporter transgenes, are used for the assessment of chemically-induced genotoxic effects in vivo. However, regulatory issues arise when different PoD values (e.g., lower BMD confidence intervals or BMDLs) are obtained for the same compound across different TGR assay variants. This study therefore employed the BMD approach to examine the ability of different TGR variants to yield comparable genotoxic potency estimates. Review of over 2000 dose-response datasets identified suitably-matched dose-response data for three compounds (ethyl methanesulfonate or EMS, N-ethyl-N-nitrosourea or ENU, and dimethylnitrosamine or DMN) across four commonly-used murine TGR variants (Muta™Mouse lacZ, Muta™Mouse cII, gpt delta and BigBlue® lacI). Dose-response analyses provided no conclusive evidence that TGR variant choice significantly influences the derived genotoxic potency estimate. This conclusion was reliant upon taking into account the importance of comparing BMD confidence intervals as opposed to directly comparing PoD values (e.g., comparing BMDLs). Comparisons with earlier works suggested that with respect to potency determination, tissue choice is potentially more important than choice of TGR assay variant. Scoring multiple tissues selected on the basis of supporting toxicokinetic information is therefore recommended. Finally, we used typical within-group variances to estimate preliminary endpoint-specific benchmark response (BMR) values across several TGR variants/tissues. We discuss why such values are required for routine use of genetic toxicity PoDs for HHRA. Environ. Mol. Mutagen. 58:632-643, 2017. © 2017 Her Majesty the Queen in Right of Canada. Environmental and Molecular Mutagenesis Published by Wiley Periodicals, Inc.

Keywords: benchmark dose; dose response analysis; genetic toxicology; human health risk assessment; transgenic rodent gene mutation assay.


Figures

Figure 1
Figure 1
Schematic overview of the BMD combined covariate approach. The benchmark dose approach (BMD) provides an estimate of the dose that will elicit a small, pre‐specified effect‐size called the benchmark response (BMR). The best‐fitting BMD model (solid curve) will result in the best estimate of the BMD. Importantly however, the uncertainty in the dose‐response data needs to be accounted for through calculation of a BMD confidence interval. The process can be conceptually visualized by imagining that, through variation of the model parameters, other curves, and BMDs that plausibly describe the data (e.g., schematically represented by the dashed curves) may be established. Together these values comprise the BMD confidence interval (solid line). In turn, this process provides estimations of the BMDL (L) and BMDU (U), the lower and upper 90% confidence bounds of the BMD estimate, respectively. Therefore, the ratio of the BMDU to BMDL represents the precision to which the true BMD can be estimated based on the available dose‐response data. A newer method termed the combined, BMD‐covariate approach allows BMDs for multiple dose‐response curves to be defined in one combined analysis employing a covariate such as compound, exposure regime, time, sex, or species to identify the constituent dose‐response relationships. The major advantage of this approach is that any model parameters that are determined to be similar across covariate subgroupings may be held constant during an analysis; thus their estimation is based on all the dose‐response curves included in the combined analysis. Concomitantly, the precision of the BMD estimate is improved (i.e., reduced BMDU‐to‐BMDL ratio) for any individual dataset under consideration.
Figure 2
Figure 2
Genotoxic potency of ethyl methanesulphonate (EMS) determined using the gpt delta Mouse (red) and Muta™Mouse (blue) transgenic rodent assays. BMD analyses, with TGR as covariate, were conducted to compare potency values (i.e., BMDs) determined using two different TGR assay variants. Two‐sided 90% confidence intervals of the BMD10 (i.e., BMR = 10%) were calculated from mutant frequency (MF) dose‐response data (i.e., gpt or lacZ MF) for bone marrow, small intestine, and liver tissues using two different BMD models: the exponential (upper interval per pair) or the Hill (lower interval per pair). Combined analyses were performed, two datasets at a time by tissue, using TGR as covariate. The dashed liver interval for the Hill model indicates an unbounded lower confidence limit (i.e., BMDL = 0). The underlying dose‐response data and fitted BMD models are presented in Supporting Information Figure S1.
Figure 3
Figure 3
Genotoxic potency of ethyl methanesulphonate (EMS) determined using the gpt delta mouse (red) and Muta™Mouse (blue) transgenic rodent assays: endpoint‐specific BMRs. BMD analysis, with endpoint‐specific BMR values, was conducted to compare BMDs determined across two TGR assay variants. Two‐sided 90% confidence intervals of the BMD, based on BMRs indicated beneath each tissue, were calculated from mutant frequency (MF) dose‐response data (i.e., gpt or lacZ transgene) for bone marrow, small intestine, and liver tissues using two different BMD models: the exponential (upper interval per pair) or the Hill (lower interval per pair). Combined analyses were performed, two datasets at a time by tissue, using TGR as covariate. The underlying dose‐response data and fitted BMD models are presented in Supporting Information Figure S2.
Figure 4
Figure 4
Genotoxic potency analysis of N‐ethyl‐N‐nitrosourea (ENU) determined using the Muta™Mouse (cII or lacZ transgenes) or gpt delta Mouse (gpt transgene) transgenic rodent assays. BMD analysis, with endpoint‐specific BMR values, was conducted to compare BMDs determined using two TGR assay variants. Two‐sided 90% confidence intervals of the BMD, based on BMRs indicated beneath each tissue, were calculated from mutant frequency (MF) dose‐response data (i.e., gpt or lacZ transgene) for bone marrow, small intestine, and liver tissues using two different BMD models: the exponential (upper interval per pair) or the Hill (lower interval per pair). Combined analyses were performed, two datasets at a time by tissue, using study as covariate. The underlying dose‐response data and fitted BMD models are presented in Supporting Information Figure S3.
Figure 5
Figure 5
Genotoxic potency analysis of dimethylnitrosamine (DMN) determined using the Muta™Mouse (blue) or BigBlue® Mouse (orange) transgenic rodent assays. BMD analysis, with endpoint‐specific BMR values, was conducted to compare BMDs determined using two TGR assay variants. Two‐sided 90% confidence intervals of the BMD, based on BMRs indicated beneath each tissue, were calculated from mutant frequency (MF) dose‐response data (i.e., lacZ or lacI transgene) in liver tissue using two different BMD models: the exponential (upper interval per pair) or the Hill (lower interval per pair). Datasets were analyzed individually. The underlying dose‐response data and fitted BMD models are presented in Supporting Information Figure S4.

Similar articles

Cited by

References

    1. Bemis JC, Wills JW, Bryce SM, Torous DK, Dertinger SD, Slob W. 2016. Comparison of in vitro and in vivo clastogenic potency based on benchmark dose analysis of flow cytometric micronucleus data. Mutagenesis 31:277–285. - PMC - PubMed
    1. Benford DJ. 2016. The use of dose‐response data in a margin of exposure approach to carcinogenic risk assessment for genotoxic chemicals in food. Mutagenesis 31:329–331. - PubMed
    1. Cao X, Mittelstaedt RA, Pearce MG, Allen BC, Soeteman‐Hernandez LG, Johnson GE, Bigger CA, Heflich RH. 2014. Quantitative dose‐response analysis of ethyl methanesulfonate genotoxicity in adult gpt‐delta transgenic mice. Environ Mol Mutagen 55:385–399. - PubMed
    1. Crump KS. 1984. A new method for determining allowable daily intakes. Fundam Appl Toxicol 4:854–871. - PubMed
    1. Dearfield KL, Gollapudi BB, Bemis JC, Benz RD, Douglas GR, Elespuru RK, Johnson GE. 2017. Next generation testing strategy for assessment of genomic damage: A conceptual framework and considerations. Environ Mol Mutagen 5:264–283. - PubMed

Publication types