. 2018 Jan;37(1):1-11.
doi: 10.1109/TMI.2017.2755550. Epub 2017 Sep 21.

Skeletal Shape Correspondence Through Entropy

Skeletal Shape Correspondence Through Entropy

Liyun Tu et al. IEEE Trans Med Imaging. 2018 Jan.

Abstract

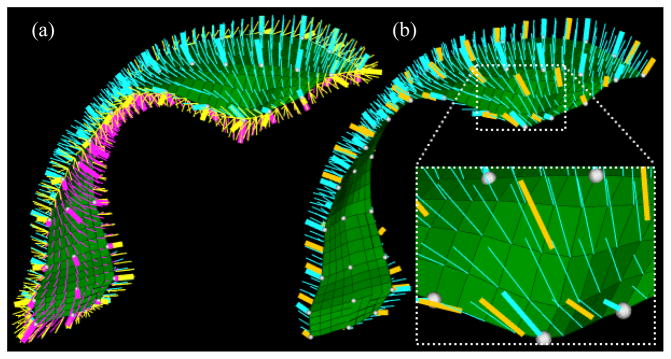
We present a novel approach for improving the shape statistics of medical image objects by generating correspondence of skeletal points. Each object's interior is modeled by an s-rep, i.e., by a sampled, folded, two-sided skeletal sheet with spoke vectors proceeding from the skeletal sheet to the boundary. The skeleton is divided into three parts: the up side, the down side, and the fold curve. The spokes on each part are treated separately and, using spoke interpolation, are shifted along that skeleton in each training sample so as to tighten the probability distribution on those spokes' geometric properties while sampling the object interior regularly. As with the surface/boundary-based correspondence method of Cates et al., entropy is used to measure both the probability distribution tightness and the sampling regularity, here of the spokes' geometric properties. Evaluation on synthetic and real world lateral ventricle and hippocampus data sets demonstrate improvement in the performance of statistics using the resulting probability distributions. This improvement is greater than that achieved by an entropy-based correspondence method on the boundary points.


Figures

Fig. 1
Fig. 1
Left: an example of s-rep for lateral ventricle that is sampled as a folded 3 ×13 skeletal sheet; right: object boundary (yellow) implied by that s-rep.
Fig. 2
Fig. 2
Discrete s-reps of two lateral cerebral ventricles, each represented as a 3 ×13 sparse grid of spokes (the colored thickened lines). The thin gray spokes are the interpolated spokes describing the object interior. The color indicates the initial correspondence before any shifting using entropies.
Fig. 3
Fig. 3
(a) Each object is modeled with three regions: an up (cyan), a down (magenta) and a fold region (yellow). The green grids represent the skeletal sheet. (b) The up skeletal sheet with the original sparse spokes shown as thickened cyan lines; the interpolated spokes shown as thin cyan lines; the shifted spokes shown in thickened yellow. The thickened cyan spokes S(u, v) are shifted to the thickened yellow position S(u + Δu, v + Δv) by a small step (Δu, Δv), and interpolating to that position.
Fig. 4
Fig. 4
(a) A skeletal sheet has its 3 × 13 skeletal points projected as a unit grid. The diamonds and balls respectively denote the interior and the exterior grid positions. Each interpolated spoke has coordinate (u + Δu, v + Δv) (e.g., the spoke at the red dot is (1.5, 1.2), and at the cyan dot (0.5, 6.6)). (b) Part of the s-rep before and after shifting. The shared skeletal points (white balls in original s-rep) split and shift to a new place with its spoke. The cyan ball is the skeletal pt. of the up spoke, magenta (down) and yellow (fold).
Fig. 5
Fig. 5
Visualization of an 3 × 8 s-rep. (a) This s-rep has 24 up/down spokes (blue/magenta lines), 18 fold spokes (red lines). These spokes form 14 skeletal quads for the up/down region, each with a corresponding boundary quad (e.g., B5 denotes a boundary quad). (b–c) Each quad is divided into (23)2 sub-quads. (d) Each sub-quad in B5 is further subdivided into two triangles. (e) An example of the curvilinear segments on the skeleton and its corresponding fold region on the boundary. H and V denote the horizontal and vertical directions respectively. More subdivision is visualized in Supplementary Fig. 1 for up/down region and Supplementary Fig. 2 for fold region.
Fig. 6
Fig. 6
(a) The template s-rep; (b) the fold curve (green curve) and fold spoke (red line) of the template and the 80 synthetic s-reps on top of each other, with the corresponding fold spoke dispersed from the original place (the red line pointing out from the green ball in oval) by a step with σ = 0.4; (c–d) the corresponding spaced spokes distribution before and after correspondence optimization, respectively. The color denotes each case in the training s-reps.
Fig. 7
Fig. 7
Left: entropies and the objective function (f(x)in (4)) during the iterations for the 80 synthetic objects; right: the changing of Egeo of the up region for the real hippocampi.
Fig. 8
Fig. 8
Comparisons between optimized and aligned s-reps for the hippocampi. (a) specificity; (b) generalization; (c-d) compactness with s-reps geometric properties and with s-rep implied PDMs, respectively. For all three metrics, lower values are desirable.
Fig. 9
Fig. 9
Comparisons between optimized and aligned s-reps for the real lateral ventricles. (a) specificity; (b) generalization; (c–d) compactness with s-reps geometric features and with s-rep-implied PDMs (∂ = 0), respectively.
Fig. 10
Fig. 10
The hippocampi (first row) and lateral ventricles (second row) model mean and ±3 standard deviations in two eigenmodes. The shapes are generated from boundary PDMs implied by the optimized s-reps level 2 (∂ = 2) spoke tips.
Fig. 11
Fig. 11
Comparisons among the optimized s-rep implied PDMs, the SPHARM-PDM and the ShapeWorks on lateral ventricles (top row) and hippocampi (bottom row). The compactness for all models were computed via CPNS. All figures share the same legend as located in the middle column.

References

    1. Cates J, Fletcher PT, Styner M, Shenton M, Whitaker R. Shape modeling and analysis with entropy-based particle systems. Proc Inf Proc Med Imag. 200720:333–345. - PMC - PubMed
    1. Styner M, Gerig G. Three-dimensional medial shape representation incorporating object variability. IEEE Conf. Comput. Vis. Pattern Recognit; Kauai, HI. 2001; p. 651.p. 656.
    1. Gerig G, Styner M, Shenton ME, Lieberman JA. Shape versus size: improved understanding of the morphology of brain structures. Proc. International Conference on Medical Image Computing and Computer Assisted Intervention (MICCAI); Netherlands. 2001; pp. 24–32.
    1. Chaney EL, Pizer SM. Autosegmentation of images in radiation oncology. J Am Coll Radiol. 2009;6(6):455–458. - PubMed
    1. Schulz J, Pizer SM, Marron JS, Godtliebsen F. Non-linear hypothesis testing of geometric object properties of shapes applied to hippocampi. J Math Imaging Vis. 2016;54(1):15–34.

Publication types