. 2017 Dec;14(12):1198-1204.
doi: 10.1038/nmeth.4435. Epub 2017 Sep 25.

Thiol-linked alkylation of RNA to assess expression dynamics

Affiliations

Thiol-linked alkylation of RNA to assess expression dynamics

Veronika A Herzog et al. Nat Methods. 2017 Dec.

Abstract

Gene expression profiling by high-throughput sequencing reveals qualitative and quantitative changes in RNA species at steady state but obscures the intracellular dynamics of RNA transcription, processing and decay. We developed thiol(SH)-linked alkylation for the metabolic sequencing of RNA (SLAM seq), an orthogonal-chemistry-based RNA sequencing technology that detects 4-thiouridine (s4U) incorporation in RNA species at single-nucleotide resolution. In combination with well-established metabolic RNA labeling protocols and coupled to standard, low-input, high-throughput RNA sequencing methods, SLAM seq enabled rapid access to RNA-polymerase-II-dependent gene expression dynamics in the context of total RNA. We validated the method in mouse embryonic stem cells by showing that the RNA-polymerase-II-dependent transcriptional output scaled with Oct4/Sox2/Nanog-defined enhancer activity, and we provide quantitative and mechanistic evidence for transcript-specific RNA turnover mediated by post-transcriptional gene regulatory pathways initiated by microRNAs and N6-methyladenosine. SLAM seq facilitates the dissection of fundamental mechanisms that control gene expression in an accessible, cost-effective and scalable manner.


Conflict of interest statement

Competing financial interest:

VAH, BR, and SLA declare competing financial interest. A patent application related to this work has been filed.

Figures

Figure 1
Figure 1. Detection of 4-thiouridine (s4U) by chemical derivatization and sequencing.
(a) 4-thiouridine (s4U) reacts with the thiol-reactive compound iodoacetamide (IAA), attaching a carboxyamidomethyl-group to the thiol-group in s4U as a result of a nucleophilic substitution (SN2) reaction. (b) Absorption spectra of 4-thiouracil (s4U) before and after treatment with iodoacetamide (IAA). Absorption maxima of educt (4-thiouracil; s4U; λmax ≈ 335 nm) and product (carboxyamido-methylated 4-thiouracil; *s4U; λmax ≈ 297 nm) are indicated. Data represents mean (center line) ± SD (whiskers) of independent experiments (untreated n=13; IAA treated n=3). (c) Normalized LC-MS extracted ion chromatograms of s4U (black) and alkylated s4U (red) at the indicated iodoacetamide concentrations. (d) Conversion rates for each position of a s4U-containing RNA before or after iodoacetamide (IAA) treatment. Average conversion rates (center line) ± SD (whiskers) of three independent experiments (points) are shown. Number of sequenced reads in each replicate (r1-r3) are indicated. Nucleotide identity at s4U site (p9) is shown.
Figure 2
Figure 2. Thiol-linked alkylation for the metabolic sequencing of RNA (SLAM-seq).
(a) Workflow of SLAM-seq. Working time for alkylation and Quant-seq library preparation are indicated. (b) Representative genome browser screen shot for three independent mRNA libraries generated from total RNA of mESCs, prepared using standard mRNA sequencing (top panel), Cap-seq (middle panel) and mRNA 3′ end sequencing (bottom panel; RPM, reads per million). A representative area in the mouse genome encoding the gene Trim 28 is shown. Bottom shows zoom into 3′ UTR of Trim28. Unnormalized coverage plots of Quant-seq libraries prepared from untreated mESCs or mESCs subjected to s4U-metabolic labeling using 100 µM s4U for 24 h followed by SLAM-seq. A random subset of individual reads underlying the coverage plots are depicted. Asterisks indicate T>C-conversions (red) or any conversion other than T>C (black). (c) Conversion rates in defined counting window-mapping reads of Quant-seq libraries, prepared from mESCs before (no s4U) and after metabolic labeling for 24 h using 100 µM s4U (+s4U). Dashed line represents expected background sequencing error rate. Median conversion rate across the indicated number of transcripts (n) is shown above Tukey boxplots. Outliers are not shown. P-value (Mann-Whitney test) is indicated. (d) Relative coverage across 8408 transcripts in Quant-seq datasets. T>C conversion rate (Conv.) distributes evenly within Quant-seq-covered areas across 8408 counting windows.
Figure 3
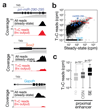
Figure 3. Quantitative description of the polyadenylated transcriptional output in mESCs.
(a) Genome browser plots of the indicated genes show SLAM-seq data prepared from mESCs, subjected to s4U-metabolic RNA labeling. Black reads represent all mapped reads (steady-state, in RPM); red reads represent T>C conversion-containing reads (de novo transcribed; trx output, in RPM). (b) Relative transcriptional output for 7179 genes in mESCs. T>C reads represent abundance of de novo transcripts in counts per million (cpm); Steady-state represents sum of T>C- and non-T>C-containing reads. Core pluripotency transcription factors are highlighted in red, a subset of primary target genes for Oct4/Sox2/Nanog (OSN) in dark blue and a gene with house-keeping function in light-blue. (c) Transcriptional output, as measured in number of T>C conversion containing reads, for expressed genes (steady-state >5cpm) without adjacent OSN enhancer (no, n=4994), proximal to canonical Oct4/Sox2/Nanog enhancer (OSN, n=2029) or proximal to strong enhancers (SE, n=156). Data is represented by Tukey-boxplots without outliers. P-values determined by Mann-Whitney test are indicated.
Figure 4
Figure 4. Global and transcript-specific mRNA stability in mESCs.
(a) Transcript stability for the indicated example genes as determined by SLAM-seq. T>C-conversion rates were determined for each timepoint of the s4U-pulse/chase and fit to a single-exponential decay model to derive half-life (t½). Values are mean ± SD of three independent cell cultures. (b) Global analysis of mRNA stability in mESCs. RNA half-life for 8405 transcripts in mESCs determined as described in (a). Single-exponential fit of median and interquartile range are shown. Median half-life before (t½) or after (t½ccn) normalization to cell divisions. (c) Cumulative distribution of ranked high-confidence transcript stabilities for 6665 transcripts. Enriched gene ontology (GO) terms for the 666 most unstable (blue) or most stable (red) are indicated. Enrichment factor (EF) and p-values (p-Val.) are indicated.
Figure 5
Figure 5. Molecular determinants of mRNA stability in mESCs.
(a) Cumulative distribution of ranked mRNA stabilities. Plotted are distributions for transcripts that do (rose, n=1450) or do not (black, n=5095) contain at least one miR-291a-family target site or contain at least one conserved miR-291a target site (red, n=50). miR-291a-family members as defined in Supplementary Fig.13g. P-value was determined by KS-test. (b) Cumulative distribution of mRNA stability changes in xpo5ko relative to wt mESCs. Plotted are distributions for transcripts that do (rose, n=1288) or do not (black, n=4825) contain at least one miR-291a target site or that contain at least one conserved miR-291a target site (red, n=42). P-value was determined by KS-test. (c) Cumulative distribution of mRNA stability changes in xpo5ko relative to wt mESCs. Plotted are distributions for transcripts that contain exclusively one 6mer (blue, n=493), 7mer-A1 (green, n=95), 7mer-m8 (yellow, n=325), or 8mer site (red, n=63). Black shows transcripts without any miR-291a target site (n=4825). P-value was determined by KS-test. (d) Cumulative distribution of ranked mRNA stabilities. Plotted are distributions for transcripts that do (red, n=3492) or do not (black, n=3173) contain the m6A mark, as previously mapped by m6A-RIP-seq. P-value was determined by KS-test. (e) Top: Schematic distribution of m6A within mRNA (adapted from31). Bottom: Cumulative distribution of ranked mRNA stabilities. Plotted are distributions for transcripts that do not (black, n=3173) or do contain m6A exclusively in the 5′ UTR (grey, n=88), the coding sequence (CDS, green, n= 545) or the 3′ UTR (red, n=2093). P-value was determined by KS-test. (f) Cumulative distribution of mRNA stability changes in mettl3ko relative to wt mESCs. Plotted are distributions for transcripts that do not (black, n=3118) or do m6A exclusively in the in the 5′ UTR (grey, n=86), the coding sequence (CDS, green, n= 518) or the 3′ UTR (red, n=2017). P-value was determined by KS-test.

References

    1. Schwanhäusser B, et al. Global quantification of mammalian gene expression control. Nature. 2011;473:337–342. - PubMed
    1. Rabani M, et al. High-Resolution Sequencing and Modeling Identifies Distinct Dynamic RNA Regulatory Strategies. Cell. 2014;159:1698–1710. - PMC - PubMed
    1. Yao SYM, Ng AML, Cass CE, Baldwin SA, Young JD. Nucleobase transport by human equilibrative nucleoside transporter 1 (hENT1) J Biol Chem. 2011;286:32552–32562. - PMC - PubMed
    1. Cleary MD, Meiering CD, Jan E, Guymon R, Boothroyd JC. Biosynthetic labeling of RNA with uracil phosphoribosyltransferase allows cell-specific microarray analysis of mRNA synthesis and decay. Nat Biotechnol. 2005;23:232–237. - PubMed
    1. Dölken L, et al. High-resolution gene expression profiling for simultaneous kinetic parameter analysis of RNA synthesis and decay. RNA. 2008;14:1959–1972. - PMC - PubMed

MeSH terms