

Establishment of primary mixed cell cultures from spontaneous canine mammary tumors: Characterization of classic and new cancer-associated molecules
- PMID: 28945747
- PMCID: PMC5612463
- DOI: 10.1371/journal.pone.0184228
Establishment of primary mixed cell cultures from spontaneous canine mammary tumors: Characterization of classic and new cancer-associated molecules
Abstract
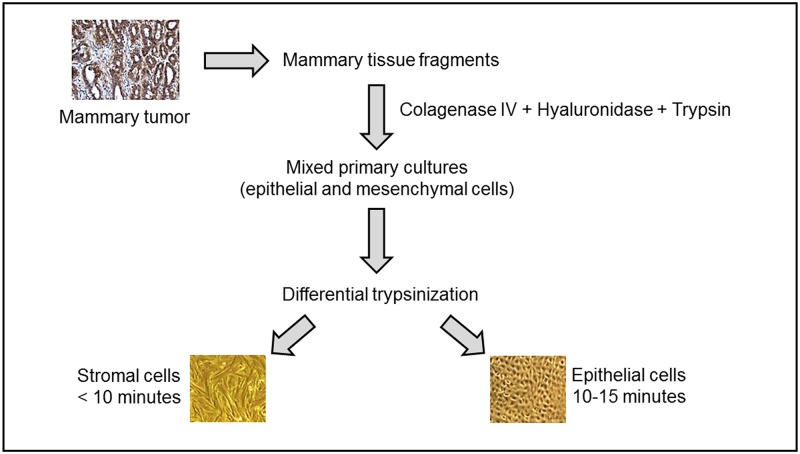
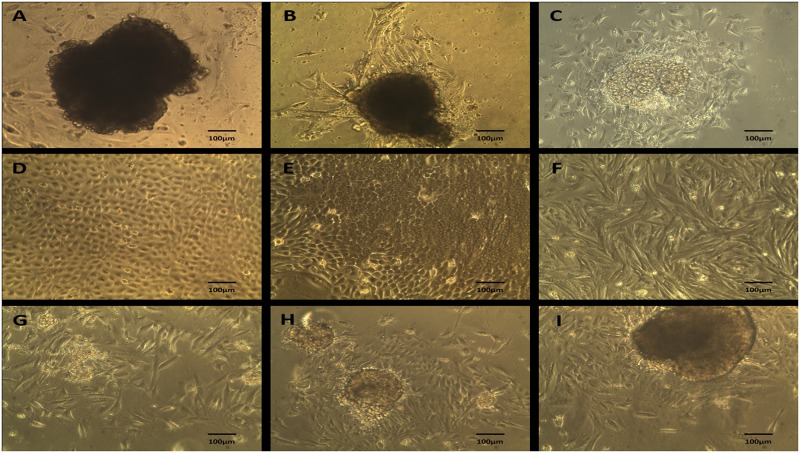
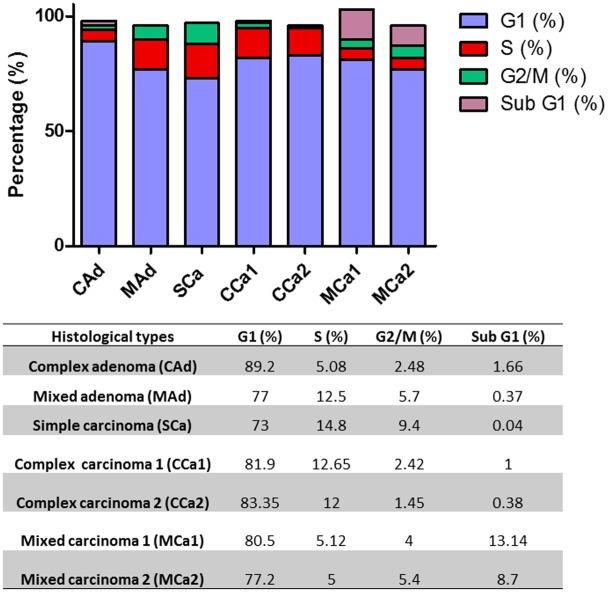
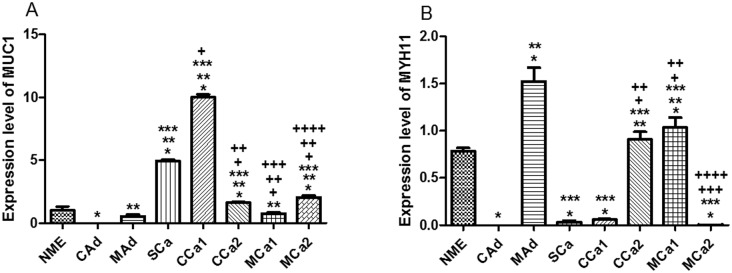
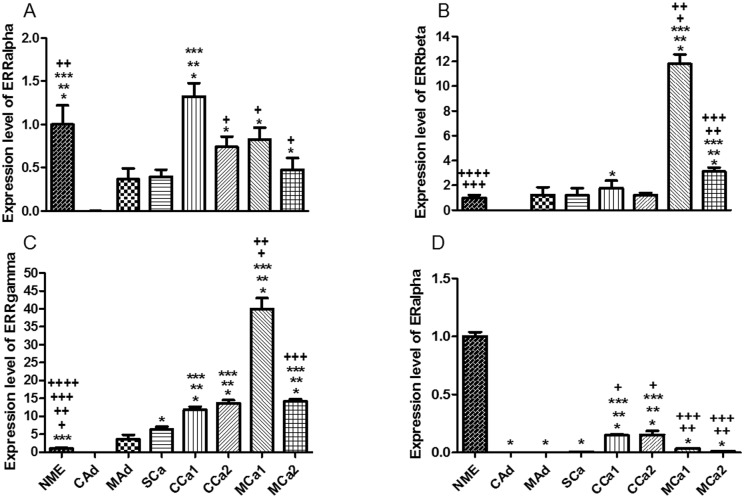
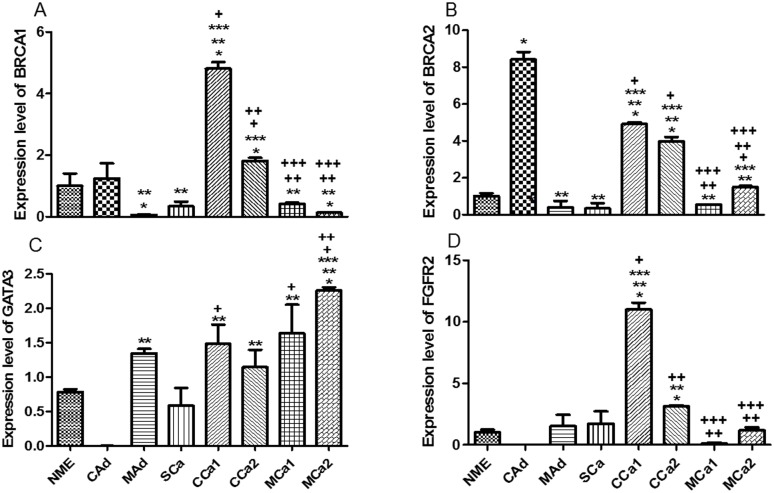
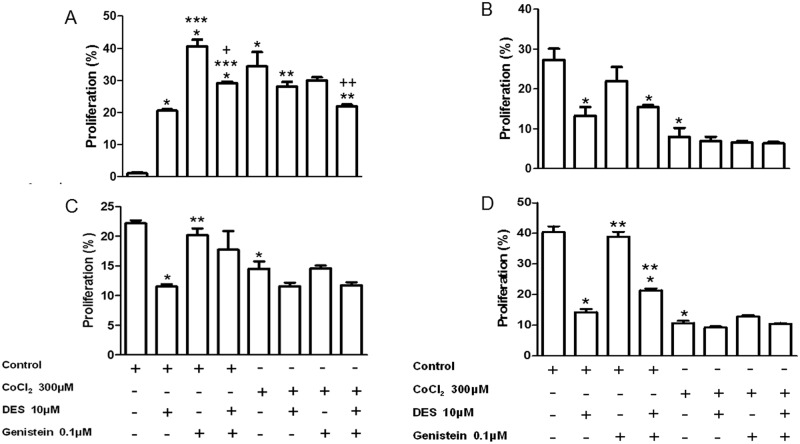
There are many factors which make canine cancer like cancer in humans. The occurrence of spontaneous mammary tumors in pet dogs, tumor genetics, molecular targets and exposure to the same environmental risk factors are among these factors. Therefore, the study of canine cancer can provide useful information to the oncology field. This study aimed to establish and characterize a panel of primary mixed cell cultures obtained from spontaneous canine mammary tumors. Eight established cell cultures obtained from one normal mammary gland, one complex adenoma, one mixed adenoma, two complex carcinomas and two mixed carcinomas were analyzed. The gene expression levels of classic molecular cancer players such as fibroblast growth factor receptor (FGFR) 2, breast cancer (BRCA) 1, BRCA2 and estrogen receptor (ESR) 1 were evaluated. For the first time, three orphan nuclear receptors, estrogen-related receptors (ERRs) α, β and γ were studied in canine mammary cancer. The highest expression level of ERRα was observed in complex carcinoma-derived cell culture, while the highest levels of ERRβ and γ were observed in cells derived from a mixed carcinoma. Meanwhile, complex carcinomas presented the highest levels of expression of ESR1, BRCA1 and FGFR2 among all samples. BRCA2 was found exclusively in complex adenoma. The transcription factor GATA3 had its highest levels in mixed carcinoma samples and its lowest levels in complex adenoma. Proliferation assays were also performed to evaluate the mixed cell cultures response to ER ligands, genistein and DES, both in normoxia and hypoxic conditions. Our results demonstrate that morphological and functional studies of primary mixed cell cultures derived from spontaneous canine mammary tumors are possible and provide valuable tool for the study of various stages of mammary cancer development.
Conflict of interest statement
Figures
Similar articles
-
Increased expression of BRCA2 and RAD51 in lymph node metastases of canine mammary adenocarcinomas.Vet Pathol. 2009 May;46(3):416-22. doi: 10.1354/vp.08-VP-0212-K-FL. Epub 2009 Jan 27. Vet Pathol. 2009. PMID: 19176491
-
Reduced canine BRCA2 expression levels in mammary gland tumors.BMC Vet Res. 2015 Jul 23;11:159. doi: 10.1186/s12917-015-0483-9. BMC Vet Res. 2015. PMID: 26202431 Free PMC article.
-
Expression of TopBP1 in canine mammary neoplasia in relation to histological type, Ki67, ERalpha and p53.Vet J. 2009 Mar;179(3):422-9. doi: 10.1016/j.tvjl.2007.10.025. Epub 2008 Mar 7. Vet J. 2009. PMID: 18314357
-
Exploring the Therapeutic Potential of BRCA1 and BRCA2 as Targets in Canine Oncology: A Comprehensive Review of Their Role in Cancer Development and Treatment.Int J Mol Sci. 2025 Feb 19;26(4):1768. doi: 10.3390/ijms26041768. Int J Mol Sci. 2025. PMID: 40004231 Free PMC article.
-
Research progress of good markers for canine mammary carcinoma.Mol Biol Rep. 2023 Dec;50(12):10617-10625. doi: 10.1007/s11033-023-08863-x. Epub 2023 Nov 9. Mol Biol Rep. 2023. PMID: 37943402 Review.
Cited by
-
Canine Mammary Cancer: State of the Art and Future Perspectives.Animals (Basel). 2023 Oct 9;13(19):3147. doi: 10.3390/ani13193147. Animals (Basel). 2023. PMID: 37835752 Free PMC article. Review.
-
Three-Dimensional Cultivation a Valuable Tool for Modelling Canine Mammary Gland Tumour Behaviour In Vitro.Cells. 2024 Apr 17;13(8):695. doi: 10.3390/cells13080695. Cells. 2024. PMID: 38667310 Free PMC article. Review.
-
Inhibitory Effects of Alpha-Connexin Carboxyl-Terminal Peptide on Canine Mammary Epithelial Cells: A Study on Benign and Malignant Phenotypes.Cancers (Basel). 2024 Feb 18;16(4):820. doi: 10.3390/cancers16040820. Cancers (Basel). 2024. PMID: 38398211 Free PMC article.
-
The Expression of Selected Factors Related to T Lymphocyte Activity in Canine Mammary Tumors.Int J Mol Sci. 2020 Mar 26;21(7):2292. doi: 10.3390/ijms21072292. Int J Mol Sci. 2020. PMID: 32225066 Free PMC article.
-
Establishment and Characterization of Canine Mammary Gland Carcinoma Cell Lines With Vasculogenic Mimicry Ability in vitro and in vivo.Front Vet Sci. 2020 Oct 27;7:583874. doi: 10.3389/fvets.2020.583874. eCollection 2020. Front Vet Sci. 2020. PMID: 33195606 Free PMC article.
References
-
- Vargo-Gogola T, Rosen JM. Modelling breast cancer: one size does not fit all. Nat Rev Cancer. 2007; 7:659–72. doi: 10.1038/nrc2193 - DOI - PubMed
-
- Hovey RC, McFadden TB, Akers RM. Regulation of mammary gland growth and morphogenesis by the mammary fat pad: a species comparison. J. Mammary Gland Biol. Neoplasia. 1999; 4: 53–68. - PubMed
-
- Balkwill F, Charles KA, Mantovani A. Smoldering and polarized inflammation in the initiation and promotion of malignant disease. Cancer Cell. 2005; 7: 211–217. doi: 10.1016/j.ccr.2005.02.013 - DOI - PubMed
-
- Goswami S, Sahai E, Wyckoff JB, Cammer M, Cox D, Pixley FJ, et al. Macrophages promote the invasion of breast carcinoma cells via a colony-stimulating factor-1/epidermal growth factor paracrine loop. Cancer Res. 2005; 65: 5278–5283. doi: 10.1158/0008-5472.CAN-04-1853 - DOI - PubMed
MeSH terms
Substances
LinkOut - more resources
Full Text Sources
Other Literature Sources
Miscellaneous
