

Melanoma screening: Informing public health policy with quantitative modelling
- PMID: 28945758
- PMCID: PMC5612464
- DOI: 10.1371/journal.pone.0182349
Melanoma screening: Informing public health policy with quantitative modelling
Abstract
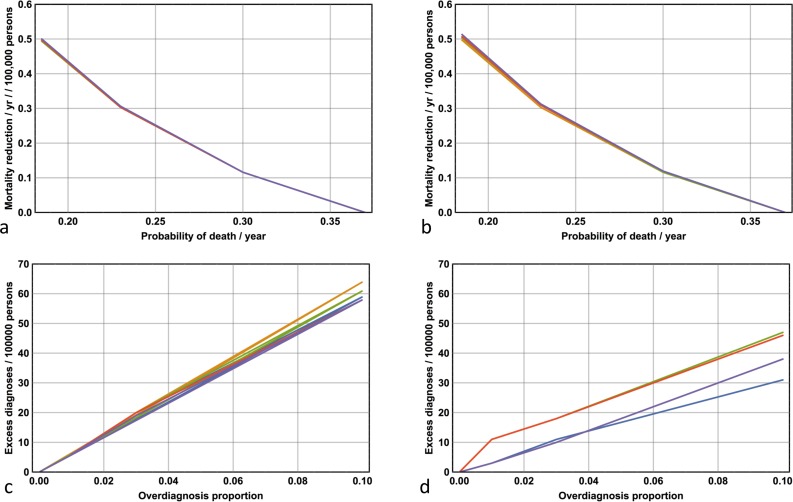
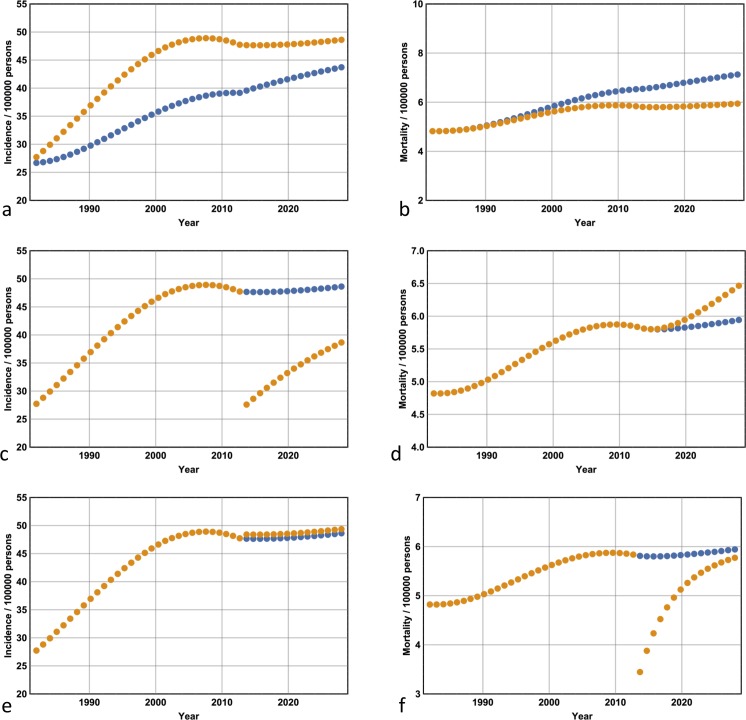
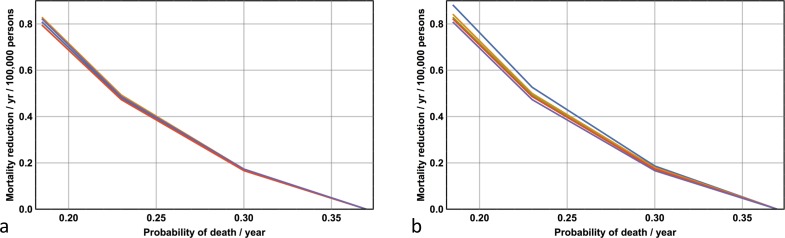
Australia and New Zealand share the highest incidence rates of melanoma worldwide. Despite the substantial increase in public and physician awareness of melanoma in Australia over the last 30 years-as a result of the introduction of publicly funded mass media campaigns that began in the early 1980s -mortality has steadily increased during this period. This increased mortality has led investigators to question the relative merits of primary versus secondary prevention; that is, sensible sun exposure practices versus early detection. Increased melanoma vigilance on the part of the public and among physicians has resulted in large increases in public health expenditure, primarily from screening costs and increased rates of office surgery. Has this attempt at secondary prevention been effective? Unfortunately epidemiologic studies addressing the causal relationship between the level of secondary prevention and mortality are prohibitively difficult to implement-it is currently unknown whether increased melanoma surveillance reduces mortality, and if so, whether such an approach is cost-effective. Here I address the issue of secondary prevention of melanoma with respect to incidence and mortality (and cost per life saved) by developing a Markov model of melanoma epidemiology based on Australian incidence and mortality data. The advantages of developing a methodology that can determine constraint-based surveillance outcomes are twofold: first, it can address the issue of effectiveness; and second, it can quantify the trade-off between cost and utilisation of medical resources on one hand, and reduced morbidity and lives saved on the other. With respect to melanoma, implementing the model facilitates the quantitative determination of the relative effectiveness and trade-offs associated with different levels of secondary and tertiary prevention, both retrospectively and prospectively. For example, I show that the surveillance enhancement that began in 1982 has resulted in greater diagnostic incidence and reduced mortality, but the reduced mortality carried a significant cost per life saved. I implement the model out to 2028 and demonstrate that the enhanced secondary prevention that began in 1982 becomes increasingly cost-effective over the period 2013-2028. On the other hand, I show that reductions in mortality achieved by significantly enhancing secondary prevention beyond 2013 levels are comparable with those achieved by only modest improvements in late-stage disease survival. Given the ballooning costs of increased melanoma surveillance, I suggest the process of public health policy decision-making-particularly with respect to the public funding of melanoma screening and discretionary mole removal-would be better served by incorporating the results of quantitative modelling.
Conflict of interest statement
Figures
Similar articles
-
Cost-Effectiveness Analysis of a Skin Awareness Intervention for Early Detection of Skin Cancer Targeting Men Older Than 50 Years.Value Health. 2017 Apr;20(4):593-601. doi: 10.1016/j.jval.2016.12.017. Epub 2017 Feb 15. Value Health. 2017. PMID: 28408001 Clinical Trial.
-
Melanoma screening: A plan for improving early detection.Ann Med. 2016;48(3):142-8. doi: 10.3109/07853890.2016.1145795. Epub 2016 Feb 25. Ann Med. 2016. PMID: 26911192 Review.
-
The changing incidence and mortality of melanoma in Australia.Recent Results Cancer Res. 2002;160:113-21. doi: 10.1007/978-3-642-59410-6_15. Recent Results Cancer Res. 2002. PMID: 12079205
-
Opportunistic screening strategy for cutaneous melanoma does not change the incidence of nodular and thick lesions nor reduce mortality: a population-based descriptive study in the European region with the highest incidence.Melanoma Res. 2013 Oct;23(5):402-7. doi: 10.1097/CMR.0b013e328363b015. Melanoma Res. 2013. PMID: 23839077
-
Advances in Prevention and Surveillance of Cutaneous Malignancies.Am J Med. 2020 Apr;133(4):417-423. doi: 10.1016/j.amjmed.2019.10.008. Epub 2019 Nov 9. Am J Med. 2020. PMID: 31712100 Free PMC article. Review.
Cited by
-
Trends in Cancers of the Skin: Insights from a Three-year Observational Cohort in Manhattan Beach, California.J Clin Aesthet Dermatol. 2022 Jan;15(1):42-47. J Clin Aesthet Dermatol. 2022. PMID: 35309270 Free PMC article.
-
The Value of Total Body Photography for the Early Detection of Melanoma: A Systematic Review.Int J Environ Res Public Health. 2021 Feb 10;18(4):1726. doi: 10.3390/ijerph18041726. Int J Environ Res Public Health. 2021. PMID: 33578996 Free PMC article.
-
Evaluation of the efficacy of 3D total-body photography with sequential digital dermoscopy in a high-risk melanoma cohort: protocol for a randomised controlled trial.BMJ Open. 2019 Nov 10;9(11):e032969. doi: 10.1136/bmjopen-2019-032969. BMJ Open. 2019. PMID: 31712348 Free PMC article.
-
Head and neck cutaneous melanoma: 5-year survival analysis in a Serbian university center.World J Surg Oncol. 2020 Nov 29;18(1):312. doi: 10.1186/s12957-020-02091-4. World J Surg Oncol. 2020. PMID: 33250053 Free PMC article.
-
Impact of Wide Local Excision on Melanoma Patient Survival: A Population-Based Study.Front Public Health. 2022 Mar 31;10:806934. doi: 10.3389/fpubh.2022.806934. eCollection 2022. Front Public Health. 2022. PMID: 35433570 Free PMC article.
References
-
- Buchanan L. Slip, slop, slap, seek, slide—is the message really getting across? Dermatology Online Journal. 2013; 19(8): 1. - PubMed
-
- Shih ST, Carter R, Sinclair C, Mihalopoulos C, Vos T. Economic evaluation of skin cancer prevention in Australia. Prev Med. 2009; 49: 449–453. doi: 10.1016/j.ypmed.2009.09.008 - DOI - PubMed
-
- Dos Santos Silva I (Ed.) Cancer Epidemiolgogy: Principles and Methods. Chapter 16. Cancer Prevention. IARC Publications; 1999; https://www.iarc.fr/en/publications/pdfs-online/epi/cancerepi/ (Accessed June, 2017).
-
- Del Mar CB, Green AC, Battistutta D. Do public media campaigns designed to increase skin cancer awareness result in increased skin excision rates? Aust NZ J Public Health. 1997; 21(7): 751–754. - PubMed
-
- Weinstock MA, Lott JP, Wang Q, Titus LJ, Onega T, Nelson HD et al. Skin Biopsy Utilization and Melanoma Incidence among Medicare Beneficiaries. Br J Dermatol. 2016; doi: 10.1111/bjd.15077 [Epub ahead of print]. - DOI - PMC - PubMed
MeSH terms
LinkOut - more resources
Full Text Sources
Other Literature Sources
Medical
