Trends in prevalence of multi drug resistant tuberculosis in sub-Saharan Africa: A systematic review and meta-analysis
- PMID: 28945771
- PMCID: PMC5612652
- DOI: 10.1371/journal.pone.0185105
Trends in prevalence of multi drug resistant tuberculosis in sub-Saharan Africa: A systematic review and meta-analysis
Abstract
Background: Multidrug resistant tuberculosis (MDR-TB), is an emerging public health problem in sub-Saharan Africa (SSA). This study aims to determine the trends in prevalence of MDR-TB among new TB cases in sub-Saharan Africa over two decades.
Methods: We searched electronic data bases and accessed all prevalence studies of MDR-TB within SSA between 2007 and 2017. We determined pooled prevalence estimates using random effects models and determined trends using meta-regression.
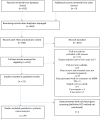
Results: Results: We identified 915 studies satisfying inclusion criteria. Cumulatively, studies reported on MDR-TB culture of 34,652 persons. The pooled prevalence of MDR-TB in new cases was 2.1% (95% CI; 1.7-2.5%). There was a non-significant decline in prevalence by 0.12% per year.
Conclusion: We found a low prevalence estimate of MDR-TB, and a slight temporal decline over the study period. There is a need for continuous MDR-TB surveillance among patients with TB.
Conflict of interest statement
Figures


References
-
- WHO | Global tuberculosis report 2016. In: WHO. http://www.who.int/tb/publications/global_report/en/. Accessed 13 May 2017
-
- WHO | Tuberculosis. In: WHO. http://www.who.int/mediacentre/factsheets/fs104/en/. Accessed 1 Apr 2017
-
- Zignol M, van Gemert W, Falzon D, Sismanidis C, Glaziou P, Floyd K, et al. (2012) Surveillance of anti-tuberculosis drug resistance in the world: an updated analysis, 2007–2010. Bull World Health Organ 90:111–119D doi: 10.2471/BLT.11.092585 - DOI - PMC - PubMed
-
- Coker RJ (2004) Review: multidrug-resistant tuberculosis: public health challenges. Trop Med Int Health 9:25–40 - PubMed
-
- WHO | WHO End TB Strategy. In: WHO. http://www.who.int/tb/post2015_strategy/en/. Accessed 13 May 2017
Publication types
MeSH terms
LinkOut - more resources
Full Text Sources
Other Literature Sources
Research Materials

