

Adenoviral vector mediated ferritin over-expression in mesenchymal stem cells detected by 7T MRI in vitro
- PMID: 28945778
- PMCID: PMC5612726
- DOI: 10.1371/journal.pone.0185260
Adenoviral vector mediated ferritin over-expression in mesenchymal stem cells detected by 7T MRI in vitro
Abstract
Objective: The aim of the present work was to verify whether adenoviral vector mediated ferritin over-expression in mesenchymal stem cells could be detected by 7T MRI device, and to explore the relationship between ferritin content and MRI signal intensities.
Methods: A recombined adenoviral vector (rAdV) encoding ferritin heavy chain (FTH1) subunit was specially designed for the aim of infecting bone marrow mesenchymal stem cells (BMSCs). Ferritin over-expression in BMSCs was determined by cell immunocytochemistry and the ferritin content in cells was determined by ELISA assay. BMSCs were subjected to cell viability, proliferation and multi-differentiation analyses as well as 7T MRI test using fast spin-echo pulse sequence. The R2 value andδR2 were calculated according to T2 mapping images.
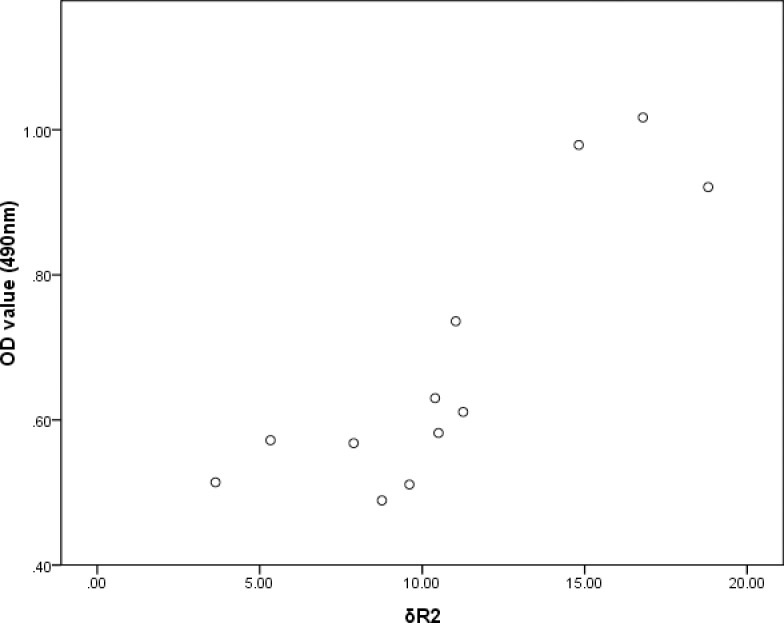
Results: As was confirmed by cell immunocytochemistry and ELISA assay, rAdV mediated ferritin was over-expressed in BMSCs. Ferritin over-expression did not interfere with stem cell viability or pluripotent differentiation but slowed cell proliferation. The R2 value of BMSCs-FTH1 vs control BMSCs from 1-4 weeks was16.65±1.28 s-1 vs 13.99±0.80 s-1, (t = 3.94, p = 0.004), 15.63±1.37 s-1 vs 13.87±0.83 s-1 (t = 2.47, p = 0.039), 15.53±0.88 s-1 vs 14.25±0.53 s-1 (t = 2.80, p = 0.023) and 14.61±1.28 s-1 vs 13.69±1.03 s-1 (t = 1.25, p = 0.24), respectively. δR2 gradually decreased from 1-4 weeks and the difference between the groups had statistical significance (F = 12.45, p<0.01).δR2 was positively correlated with OD value (r = 0.876, p<0.01) and ferritin concentration (r = 0.899, p<0.01) as determined by Pearson correlation.
Conclusions: Our study confirms that ferritin could be over-expressed in BMSCs as a result of rAdV mediated infection and could be quantitatively detected by 7T MRI device. The differences in T2 signal intensities and R2 values stem from internal contrast generated by endogenous ferritin over-expression. The correlation between δR2, OD and ferritin concentration suggests that MRI can detect ferritin signal change accurately.
Conflict of interest statement
Figures


Similar articles
-
MRI Tracking of SPIO- and Fth1-Labeled Bone Marrow Mesenchymal Stromal Cell Transplantation for Treatment of Stroke.Contrast Media Mol Imaging. 2019 Aug 29;2019:5184105. doi: 10.1155/2019/5184105. eCollection 2019. Contrast Media Mol Imaging. 2019. PMID: 31531004 Free PMC article.
-
Use of Ferritin Expression, Regulated by Neural Cell-Specific Promoters in Human Adipose Tissue-Derived Mesenchymal Stem Cells, to Monitor Differentiation with Magnetic Resonance Imaging In Vitro.PLoS One. 2015 Jul 15;10(7):e0132480. doi: 10.1371/journal.pone.0132480. eCollection 2015. PLoS One. 2015. PMID: 26176961 Free PMC article.
-
Effects of mesenchymal stem cells transfected with human hepatocyte growth factor gene on healing of burn wounds.Chin J Traumatol. 2010 Dec;13(6):349-55. Chin J Traumatol. 2010. PMID: 21126393
-
Noninvasive MRI and multilineage differentiation capability of ferritin-transduced human mesenchymal stem cells.NMR Biomed. 2015 Feb;28(2):168-79. doi: 10.1002/nbm.3236. Epub 2014 Dec 1. NMR Biomed. 2015. PMID: 25448225
-
Tracing type 1 diabetic Tibet miniature pig's bone marrow mesenchymal stem cells in vitro by magnetic resonance imaging (1).J Diabetes. 2014 Mar;6(2):123-31. doi: 10.1111/1753-0407.12084. Epub 2013 Sep 30. J Diabetes. 2014. PMID: 23962175
Cited by
-
Magnetic Nanoparticles and Magnetic Field Exposure Enhances Chondrogenesis of Human Adipose Derived Mesenchymal Stem Cells But Not of Wharton Jelly Mesenchymal Stem Cells.Front Bioeng Biotechnol. 2021 Oct 18;9:737132. doi: 10.3389/fbioe.2021.737132. eCollection 2021. Front Bioeng Biotechnol. 2021. PMID: 34733830 Free PMC article.
-
MRI Tracking of SPIO- and Fth1-Labeled Bone Marrow Mesenchymal Stromal Cell Transplantation for Treatment of Stroke.Contrast Media Mol Imaging. 2019 Aug 29;2019:5184105. doi: 10.1155/2019/5184105. eCollection 2019. Contrast Media Mol Imaging. 2019. PMID: 31531004 Free PMC article.
-
Study on immunogenicity of recombinant ferritin hemagglutinin of canine distemper virus.Virol J. 2025 Jul 28;22(1):260. doi: 10.1186/s12985-025-02802-x. Virol J. 2025. PMID: 40722102 Free PMC article.
-
Stem Cell Tracing Through MR Molecular Imaging.Tissue Eng Regen Med. 2018 Jan 16;15(3):249-261. doi: 10.1007/s13770-017-0112-8. eCollection 2018 Jun. Tissue Eng Regen Med. 2018. PMID: 30603551 Free PMC article. Review.
References
-
- Huang P, Lin LM, Wu XY, Tang QL, Feng XY, Lin GY, et al. Differentiation of human umbilical cord Wharton's jelly-derived mesenchymal stem cells into germ-like cells in vitro. J Cell Biochem. 2010;109(4):747–54. Epub 2010/01/07. doi: 10.1002/jcb.22453 . - DOI - PubMed
-
- Pittenger MF, Mackay AM, Beck SC, Jaiswal RK, Douglas R, Mosca JD, et al. Multilineage potential of adult human mesenchymal stem cells. Science. 1999;284(5411):143–7. Epub 1999/04/02. . - PubMed
-
- Wang HS, Hung SC, Peng ST, Huang CC, Wei HM, Guo YJ, et al. Mesenchymal stem cells in the Wharton's jelly of the human umbilical cord. Stem Cells. 2004;22(7):1330–7. Epub 2004/12/08. 22/7/1330 [pii] doi: 10.1634/stemcells.2004-0013 . - DOI - PubMed
-
- Peng J, Wang Y, Zhang L, Zhao B, Zhao Z, Chen J, et al. Human umbilical cord Wharton's jelly-derived mesenchymal stem cells differentiate into a Schwann-cell phenotype and promote neurite outgrowth in vitro. Brain Res Bull. 2011;84(3):235–43. Epub 2011/01/05. S0361-9230(10)00298-4 [pii] doi: 10.1016/j.brainresbull.2010.12.013 . - DOI - PubMed
-
- He G, Zhang H, Wei H, Wang Y, Zhang X, Tang Y, et al. In vivo imaging of bone marrow mesenchymal stem cells transplanted into myocardium using magnetic resonance imaging: a novel method to trace the transplanted cells. Int J Cardiol. 2007;114(1):4–10. Epub 2006/06/09. S0167-5273(06)00153-7 [pii] doi: 10.1016/j.ijcard.2005.11.112 . - DOI - PubMed
MeSH terms
Substances
LinkOut - more resources
Full Text Sources
Other Literature Sources
Medical
Research Materials
Miscellaneous
