

Estrogen Activation by Steroid Sulfatase Increases Colorectal Cancer Proliferation via GPER
- PMID: 28945888
- PMCID: PMC5718700
- DOI: 10.1210/jc.2016-3716
Estrogen Activation by Steroid Sulfatase Increases Colorectal Cancer Proliferation via GPER
Abstract
Context: Estrogens affect the incidence and progression of colorectal cancer (CRC), although the precise molecular mechanisms remain ill-defined.
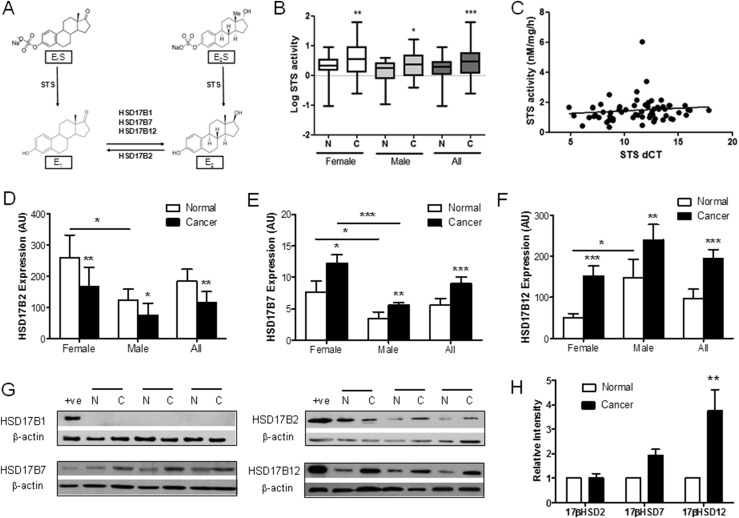
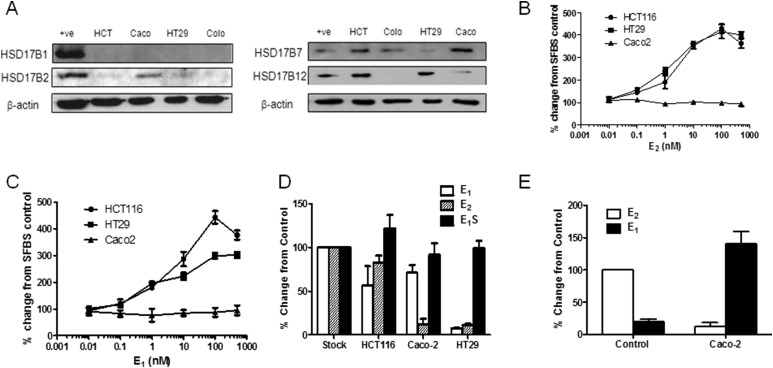
Objective: The present study investigated prereceptor estrogen metabolism through steroid sulphatase (STS) and 17β-hydroxysteroid dehydrogenase activity and subsequent nongenomic estrogen signaling in human CRC tissue, in The Cancer Genome Atlas colon adenocarcinoma data set, and in in vitro and in vivo CRC models. We aimed to define and therapeutically target pathways through which estrogens alter CRC proliferation and progression.
Design, setting, patients, and interventions: Human CRC samples with normal tissue-matched controls were collected from postmenopausal female and age-matched male patients. Estrogen metabolism enzymes and nongenomic downstream signaling pathways were determined. CRC cell lines were transfected with STS and cultured for in vitro and in vivo analysis. Estrogen metabolism was determined using an ultra-performance liquid chromatography-tandem mass spectrometry method.
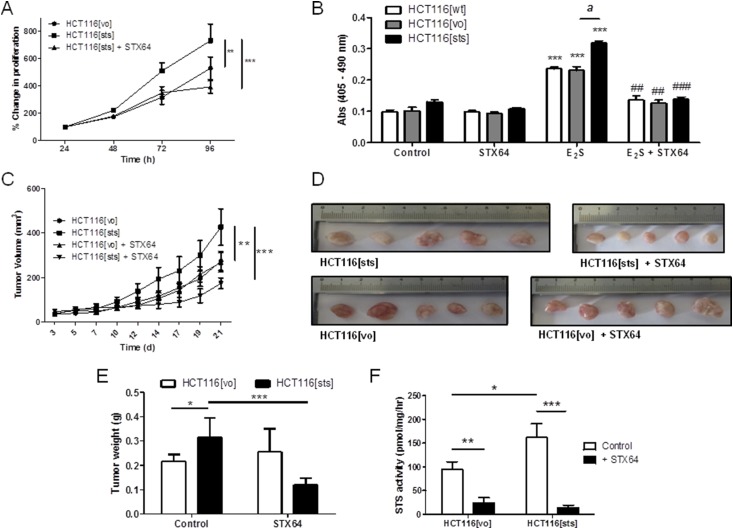
Primary outcome measure: The proliferative effects of estrogen metabolism were evaluated using 5-bromo-2'-deoxyuridine assays and CRC mouse xenograft studies.
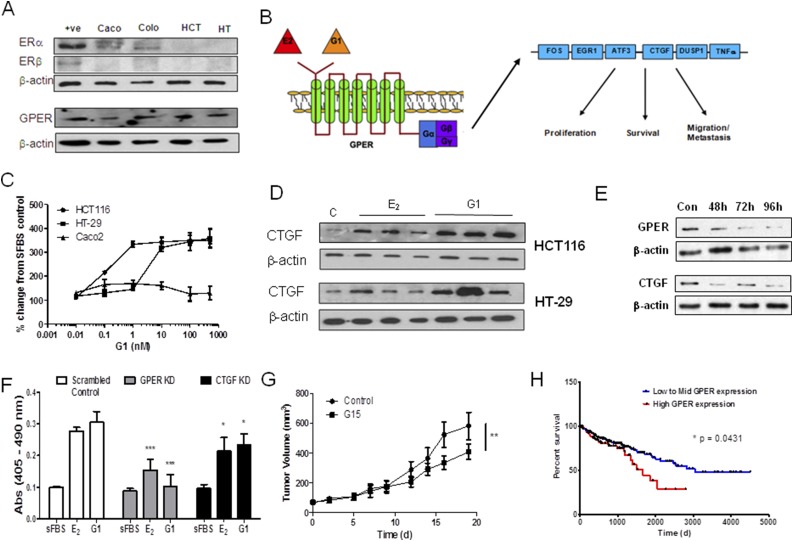
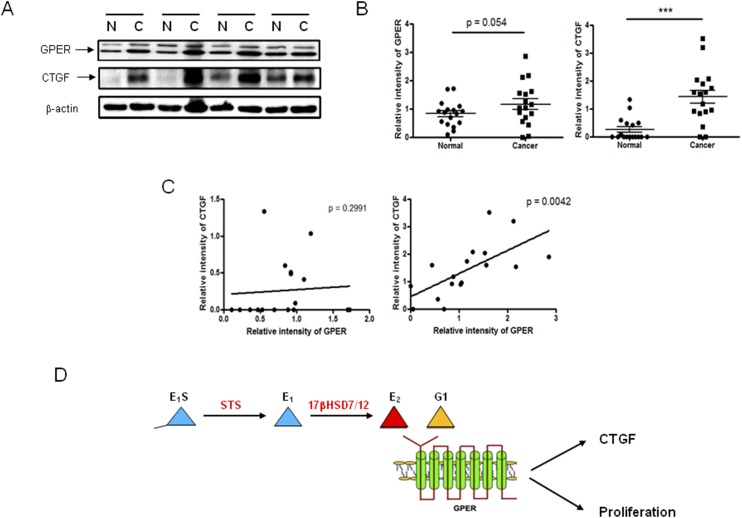
Results: Human CRC exhibits dysregulated estrogen metabolism, favoring estradiol synthesis. The activity of STS, the fundamental enzyme that activates conjugated estrogens, is significantly (P < 0.001) elevated in human CRC compared with matched controls. STS overexpression accelerates CRC proliferation in in vitro and in vivo models, with STS inhibition an effective treatment. We defined a G-protein-coupled estrogen receptor (GPER) proproliferative pathway potentially through increased expression of connective tissue growth factor in CRC.
Conclusion: Human CRC favors estradiol synthesis to augment proliferation via GPER stimulation. Further research is required regarding whether estrogen replacement therapy should be used with caution in patients at high risk of developing CRC.
Copyright © 2017 Endocrine Society
Figures
Similar articles
-
Epigenetic down regulation of G protein-coupled estrogen receptor (GPER) functions as a tumor suppressor in colorectal cancer.Mol Cancer. 2017 May 5;16(1):87. doi: 10.1186/s12943-017-0654-3. Mol Cancer. 2017. PMID: 28476123 Free PMC article.
-
G protein-coupled estrogen receptor (GPER) mediates NSCLC progression induced by 17β-estradiol (E2) and selective agonist G1.Med Oncol. 2015 Apr;32(4):104. doi: 10.1007/s12032-015-0558-2. Epub 2015 Mar 6. Med Oncol. 2015. PMID: 25744245
-
G protein-coupled estrogen receptor in colon function, immune regulation and carcinogenesis.World J Gastroenterol. 2019 Aug 14;25(30):4092-4104. doi: 10.3748/wjg.v25.i30.4092. World J Gastroenterol. 2019. PMID: 31435166 Free PMC article. Review.
-
G protein-coupled estrogen receptor-1 agonist induces chemotherapeutic effect via ER stress signaling in gastric cancer.BMB Rep. 2019 Nov;52(11):647-652. doi: 10.5483/BMBRep.2019.52.11.007. BMB Rep. 2019. PMID: 31234952 Free PMC article.
-
Oestrogen and colorectal cancer: mechanisms and controversies.Int J Colorectal Dis. 2013 Jun;28(6):737-49. doi: 10.1007/s00384-012-1628-y. Epub 2013 Jan 15. Int J Colorectal Dis. 2013. PMID: 23319136 Review.
Cited by
-
A review on the role of fatty acids in colorectal cancer progression.Front Pharmacol. 2022 Dec 12;13:1032806. doi: 10.3389/fphar.2022.1032806. eCollection 2022. Front Pharmacol. 2022. PMID: 36578540 Free PMC article. Review.
-
Roles of G Protein-Coupled Receptors (GPCRs) in Gastrointestinal Cancers: Focus on Sphingosine 1-Shosphate Receptors, Angiotensin II Receptors, and Estrogen-Related GPCRs.Cells. 2021 Nov 3;10(11):2988. doi: 10.3390/cells10112988. Cells. 2021. PMID: 34831211 Free PMC article. Review.
-
GPCRs and fibroblast heterogeneity in fibroblast-associated diseases.FASEB J. 2023 Aug;37(8):e23101. doi: 10.1096/fj.202301091. FASEB J. 2023. PMID: 37486603 Free PMC article. Review.
-
Differences in the role of Gper1 in colorectal cancer progression depending on sex.Oncol Lett. 2025 Apr 17;29(6):305. doi: 10.3892/ol.2025.15051. eCollection 2025 Jun. Oncol Lett. 2025. PMID: 40321663 Free PMC article.
-
Estradiol and progesterone regulate proliferation and apoptosis in colon cancer.Endocr Connect. 2019 Mar 1;8(3):217-229. doi: 10.1530/EC-18-0374. Endocr Connect. 2019. PMID: 30738018 Free PMC article.
References
-
- Grodstein F, Newcomb PA, Stampfer MJ. Postmenopausal hormone therapy and the risk of colorectal cancer: a review and meta-analysis. Am J Med. 1999;106(5):574–582. - PubMed
-
- Lin KJ, Cheung WY, Lai JY, Giovannucci EL. The effect of estrogen vs. combined estrogen-progestogen therapy on the risk of colorectal cancer. Int J Cancer. 2012;130(2):419–430. - PubMed
MeSH terms
Substances
Grants and funding
LinkOut - more resources
Full Text Sources
Other Literature Sources
Medical
