. 2017 Dec;174(23):4493-4507.
doi: 10.1111/bph.14052. Epub 2017 Nov 2.

Human podocytes express functional thermosensitive TRPV channels

Affiliations

Human podocytes express functional thermosensitive TRPV channels

Lídia Ambrus et al. Br J Pharmacol. 2017 Dec.

Abstract

Background and purpose: Heat-sensitive transient receptor potential vanilloid (TRPV) channels are expressed in various epithelial tissues regulating, among else, barrier functions. Their expression is well established in the distal nephron; however, we have no data about their presence in podocytes. As podocytes are indispensable in the formation of the glomerular filtration barrier, we investigated the presence and function of Ca2+ -permeable TRPV1-4 channels in human podocyte cultures.

Experimental approach: Expression of TRPV1-4 channels was investigated at protein (immunocytochemistry, Western blot) and mRNA (Q-PCR) level in a conditionally immortalized human podocyte cell line. Channel function was assessed by measuring intracellular Ca2+ concentration using Flou-4 Ca2+ -indicator dye and patch clamp electrophysiology upon applying various activators and inhibitors.

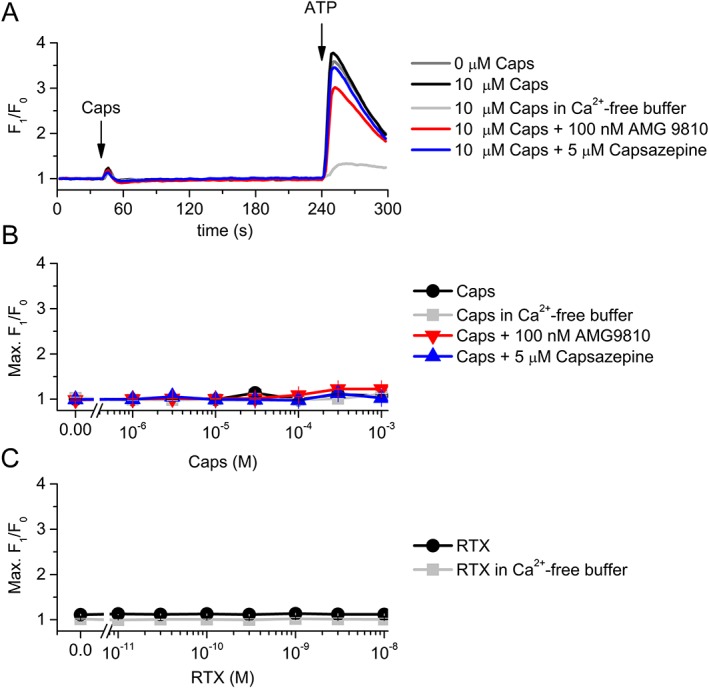
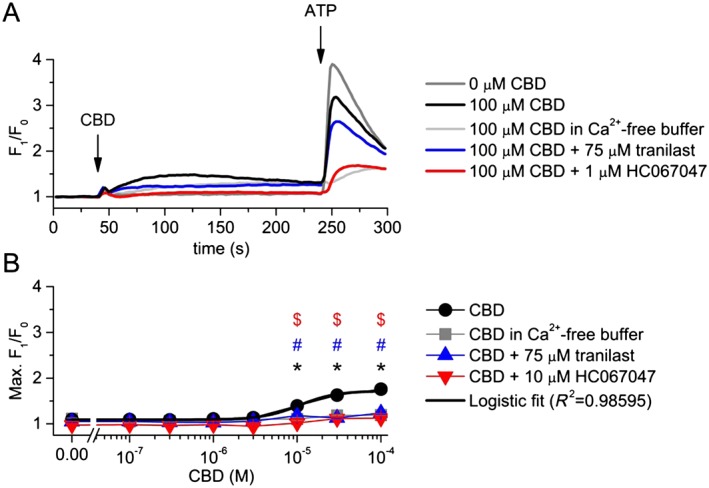
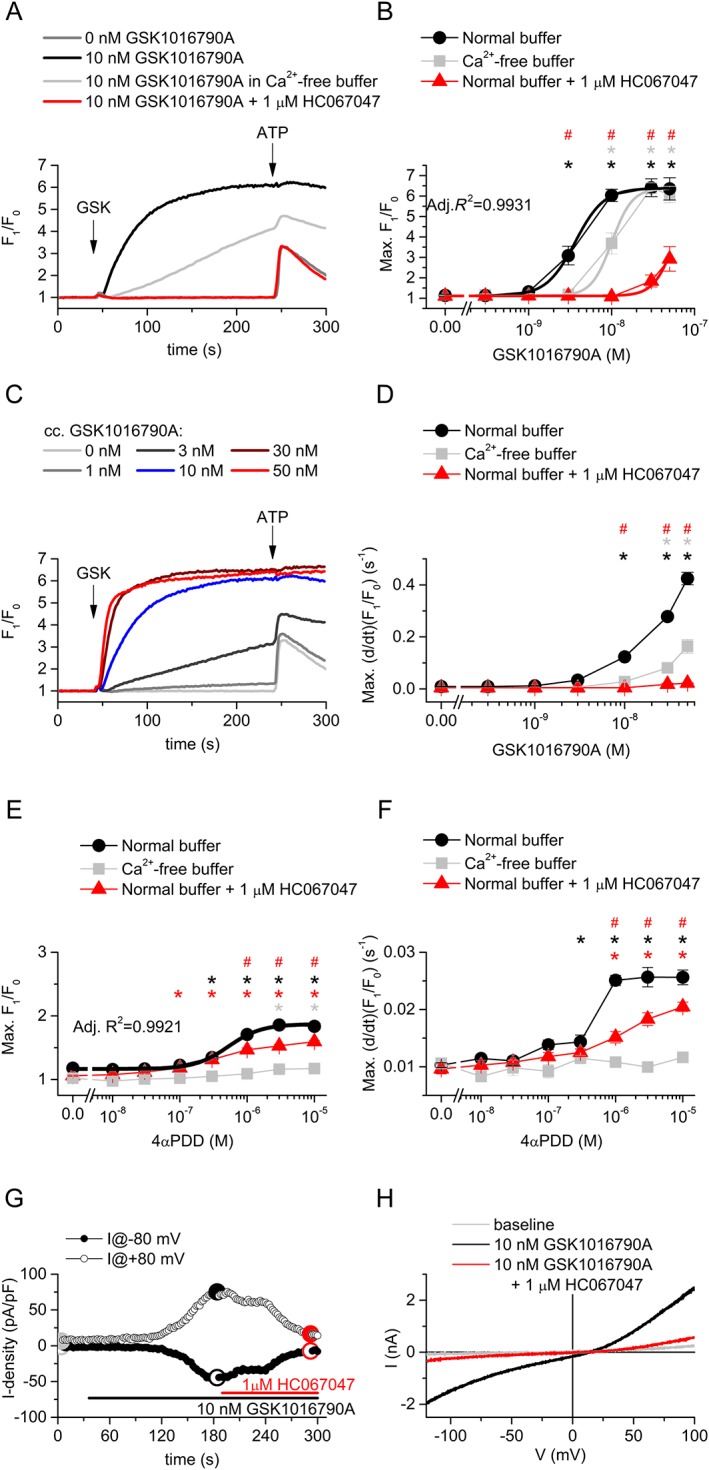
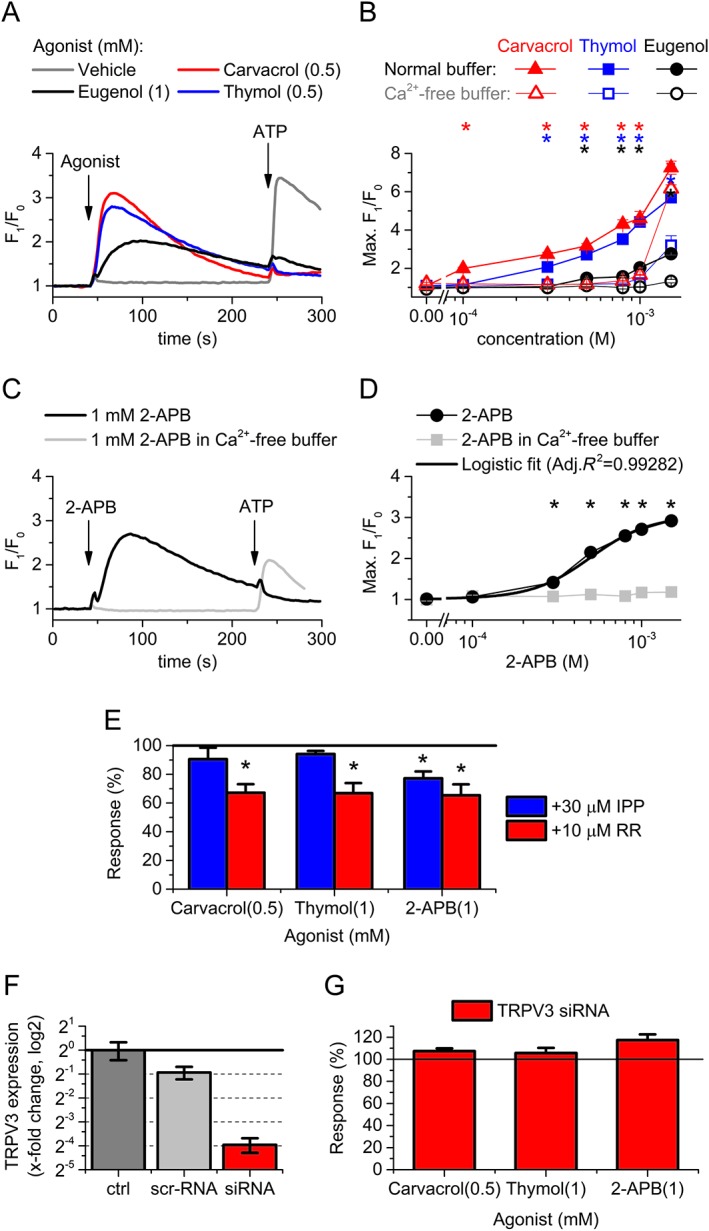
Key results: Thermosensitive TRP channels were expressed in podocytes. The TRPV1-specific agonists capsaicin and resiniferatoxin did not affect the intracellular Ca2+ concentration. Cannabidiol, an activator of TRPV2 and TRPV4 channels, induced moderate Ca2+ -influxes, inhibited by both tranilast and HC067047, blockers of TRPV2 and TRPV4 channels respectively. The TRPV4-specific agonists GSK1016790A and 4α-phorbol 12,13-didecanoate induced robust Ca2+ -signals which were abolished by HC067047. Non-specific agonists of TRPV3 channels induced marked Ca2+ transients. However, TRPV3 channel blockers, ruthenium red and isopentenyl diphosphate only partly inhibited the responses and TRPV3 silencing was ineffective suggesting remarkable off-target effects of the compounds.

Conclusion and implications: Our results indicate the functional presence of TRPV4 and other thermosensitive TRPV channels in human podocytes and raise the possibility of their involvement in the regulation of glomerular filtration barrier.


Figures

Figure 1
Figure 1
Expression of thermosensitive TRPV1–4 channels in differentiated human podocytes. (A) TRPV1–4 immunoreactivity was detected in differentiated human podocyte cultures by fluorescent labelling (Alexa‐Fluor®‐488, green fluorescence). Nuclei were counterstained with DAPI (blue fluorescence). Calibration mark: 50 μm. (B) Lysates of non‐differentiated (nDif) and differentiated (Dif) human podocytes were subjected to Western blot analysis and immunolabelled with specific TRPV antibodies. To assess equal loading of protein samples, expression of β‐actin was determined. MW indicates molecular weight in kDa. (C) Expression of TRPV1–4 mRNA transcripts was detected by Q‐PCR in non‐differentiated and differentiated human podocytes. Expression of PPIA (cyclophilin A), β‐actin and GAPDH were determined, and the geometrical mean of their expression was used as internal control for normalization. Data are expressed as mean ± SEM, n = 3 independent determinations. (D) Representative images illustrating the effect of a heat pulse on differentiated podocytes. Cells were uploaded with the fluorescent Ca2+ sensitive dye Fluo‐4 and challenged to a heat pulse. Arrowheads indicate representative cells displaying increase in intracellular Ca2+ concentration upon heat stimulation. (E) Representative Ca2+ traces obtained from the experiment shown in panel (D). The colours of the traces correspond to the colours of the arrowheads in panel (D). (F) Changes in intracellular Ca2+ concentration in differentiated podocytes upon control and heat pulse stimulations. Markings of the box plot represents 25 to 50 to 75 percentile of the cells, and thick line and whiskers indicate the mean and ±1 SD of the maximal Ca2+ signals respectively. *P < 0.05, significantly different as indicated; Mann–Whitney U‐test.
Figure 2
Figure 2
Effect of TRPV1 channel ligands on the intracellular Ca2+ concentration of differentiated human podocytes. (A) Representative time course of capsaicin (Caps) application in various conditions. Cells were preincubated with capsazepine and AMG 9810 for 30 min, and constant concentrations of the antagonists were presented as indicated on the figure continuously during the measurements. (B) Dose–response relationship of capsaicin in various conditions as indicated. The measurements were carried out as in panel (A). Data are means ± SEM, n = 6 in each group. (C) Dose–response relationship of resiniferatoxin (RTX) in normal and Ca2+‐free buffer. The measurements were carried out as in panel (A), but RTX was applied instead of capsaicin. Data are presented as mean ± SEM, n = 5 in each group.
Figure 3
Figure 3
Effect of CBD on the intracellular Ca2+ concentration of differentiated human podocytes. (A) Representative time course of CBD applications in various conditions. Cells were preincubated with tranilast and HC067047 for 30 min, and measurements were carried out in the continuous presence of constant antagonist concentrations as indicated on the figure. (B) Dose–response relationship of CBD in various conditions as indicated. The measurements were carried out as in panel (A). Data are means ± SEM, n = 6 in each group. Logistic dose–response curve fitting was carried out as described in the ‘Methods’. *P < 0.05, significant difference between CBD and vehicle (0 μM CBD). # P < 0.05, significant inhibition by 75 μM tranilast. $ P < 0.05, significant inhibition by 1 μM HC067047.
Figure 4
Figure 4
Activation of TRPV4 channels in differentiated human podocytes. (A) Representative time courses of the effect of the TRPV4 channel agonist GSK1016790A, in different conditions. Cells were preincubated with HC067047 for 30 min, and measurements were carried out in the continuous presence of constant antagonist concentrations as indicated on the figure. (B) Dose–response relationship of GSK1016790A in various conditions as indicated in the Figure. Measurements were carried out as shown in panel (A). Data are means ± SEM, n = 6 in each group. Logistic dose–response curve was fitted assuming equal efficacy (i.e. equal maximal responses available) in each condition. (C) Representative time courses upon application of various concentration of GSK1016790A in normal buffer illustrating the concentration dependence of the slope of the Ca2+ transients. (D) Concentration dependence of the maximal slope of the Ca2+ transients upon GSK1016790A application, n = 6 in each group. (E) Dose–response relationship of 4‐αPDD in various conditions as indicated in the legend. Measurements were carried out as shown in panel (A), but 4‐αPDD was used instead of GSK1016790A. Data are means ± SEM, n = 5 in each group. Logistic dose–response curve was fitted. (F) Concentration dependence of the maximal slope of the Ca2+ signals upon 4‐αPDD application, n = 5 in each group. (G) Representative time courses illustrating the effect of GSK1016790A and HC067047 on transmembrane currents of podocytes measured at −80 and +80 mV. A voltage ramp from −120 to +100 mV was applied at every 2 s. (F) I–V relationship of the transmembrane currents at different time points as indicated in panel (E). In (B), (D), (E) and (F), *P < 0.05, significant activation by GSK1016790A, compared with vehicle (0 nM GSK1016790A) control in the same conditions. # P < 0.05, significant inhibition by 1 μM HC067047.
Figure 5
Figure 5
Effect of TRPV3 channel activators on the intracellular Ca2+ concentration of differentiated human podocytes. (A) Representative time courses showing the application of TRPV3 channel activators on differentiated human podocytes in normal buffer. Activators and ATP as positive control were applied as shown in the figure. (B) Dose–response relationship of carvacrol, thymol and eugenol in normal and Ca2+‐free buffer. Measurements were carried out as shown in panel (A). (C) Representative time courses showing the effect of 2‐APB on differentiated human podocytes in normal and Ca2+‐free buffer. (D) Dose–response relationship of 2‐APB treatment as shown in panel (C). (B and D) Data are means ± SEM, n = 6 in each group. *P < 0.05, significant activation by the compound indicated, compared with vehicle (0 μM compound) in normal buffer. (E) Effect of potential inhibitors of TRPV3 channels, ruthenium red (RR) and IPP on selected concentrations of carvacrol, thymol and 2‐APB. Data are presented as percent of the average of the corresponding control (i.e. agonist application in the absence of the antagonist). This normalization was carried out to control the variance of the effectivity between different agonists and make comparable the inhibition evoked by the antagonists in the different groups. Response was calculated as the maximal amplitude (max. F1/F0–1) of the Ca2+ transients during the agonist application. Cells were pretreated with the inhibitors for 30 min before the agonist application, and the whole experiment was carried out in the continuous presence of the inhibitors in fixed concentration. Data are means ± SEM, n = 6 in each group. *P < 0.05, significant inhibition by IPP or ruthenium red; ANOVA with Dunnett post hoc test. (F) Changes in the expression of TRPV3 mRNA transcripts 48 h following transfection with either non‐coding, scramled RNA (scr‐RNA) or siRNA targeting TRPV3 (siRNA). Data are normalized to the average of the untransfected control to indicate the fold change in the expression of TRPV3 protein. Normalized data are presented as mean ± SEM of three independent determinations. (G) Effect of siRNA transfection targeting TRPV3 on the Ca2+ signals evoked by the indicated agonists. Measurements were carried out at 48 h after transfection. Averages of the corresponding control treatments on scrambled RNA transfected cells are considered as 100% in each case to control the variance of the effectivity between different agonists and make comparable the effect of the siRNA transfection in the different groups. Data are means ± SEM, n = 6 in each group.

Similar articles

Cited by

References

    1. Akazawa Y, Yuki T, Yoshida H, Sugiyama Y, Inoue S (2013). Activation of TRPV4 strengthens the tight‐junction barrier in human epidermal keratinocytes. Skin Pharmacol Physiol 26: 15–21. - PubMed
    1. Alexander SPH, Catterall WA, Kelly E, Marrion N, Peters JA, Benson HE et al (2015a). The Concise Guide to PHARMACOLOGY 2015/16: Voltage‐gated ion channels. Br J Pharmacol 172: 5904–5941. - PMC - PubMed
    1. Alexander SPH, Peters JA, Kelly E, Marrion N, Benson HE, Faccenda E et al (2015b). The Concise Guide to PHARMACOLOGY 2015/16: Ligand‐gated ion channels. Br J Pharmacol 172: 5870–5903. - PMC - PubMed
    1. Alexander SPH, Kelly E, Marrion N, Peters JA, Benson HE, Faccenda E et al (2015c). The Concise Guide to PHARMACOLOGY 2015/16: Transporters. Br J Pharmacol 172: 6110–6202. - PMC - PubMed
    1. Alvarez DF, King JA, Weber D, Addison E, Liedtke W, Townsley MI (2006). Transient receptor potential vanilloid 4–mediated disruption of the alveolar septal barrier: a novel mechanism of acute lung injury. Circ Res 99: 988–995. - PMC - PubMed