. 2018 Feb;14(2):230-242.
doi: 10.1016/j.jalz.2017.07.754. Epub 2017 Sep 22.

Apolipoprotein E4 inhibits autophagy gene products through direct, specific binding to CLEAR motifs

Affiliations

Apolipoprotein E4 inhibits autophagy gene products through direct, specific binding to CLEAR motifs

Paul A Parcon et al. Alzheimers Dement. 2018 Feb.

Abstract

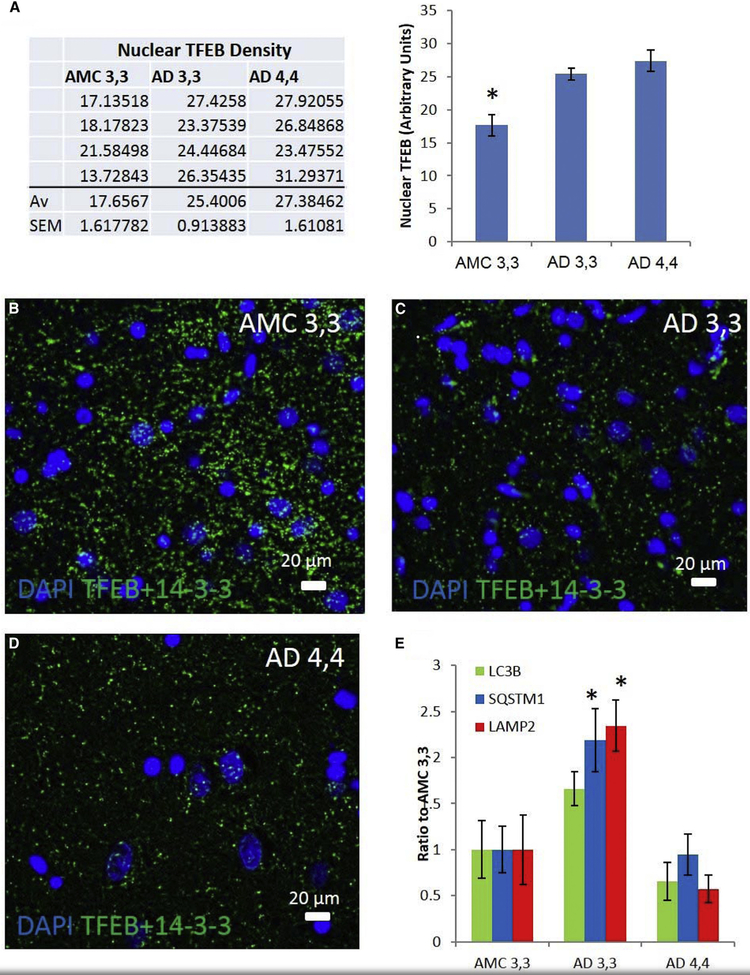
Introduction: Alzheimer apolipoprotein E (APOE) ɛ4/ɛ4 carriers have earlier disease onset and more protein aggregates than patients with other APOE genotypes. Autophagy opposes aggregation, and important autophagy genes are coordinately regulated by transcription factor EB (TFEB) binding to "coordinated lysosomal expression and regulation" (CLEAR) DNA motifs.

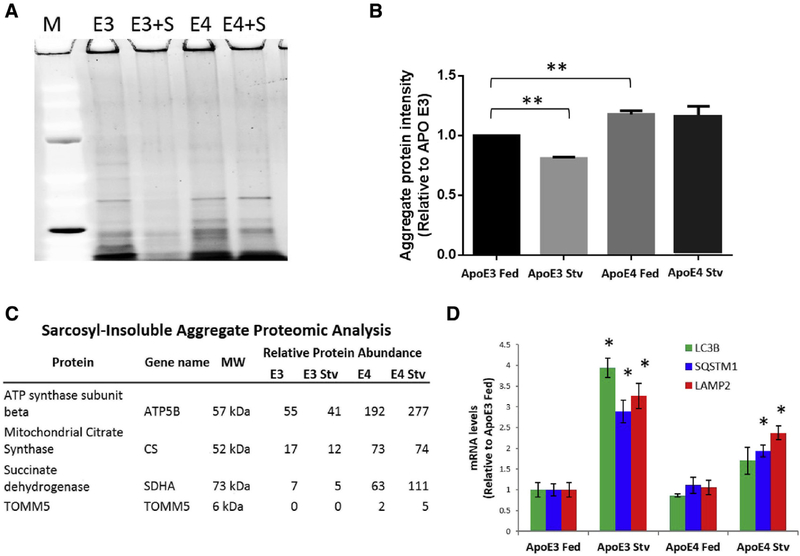
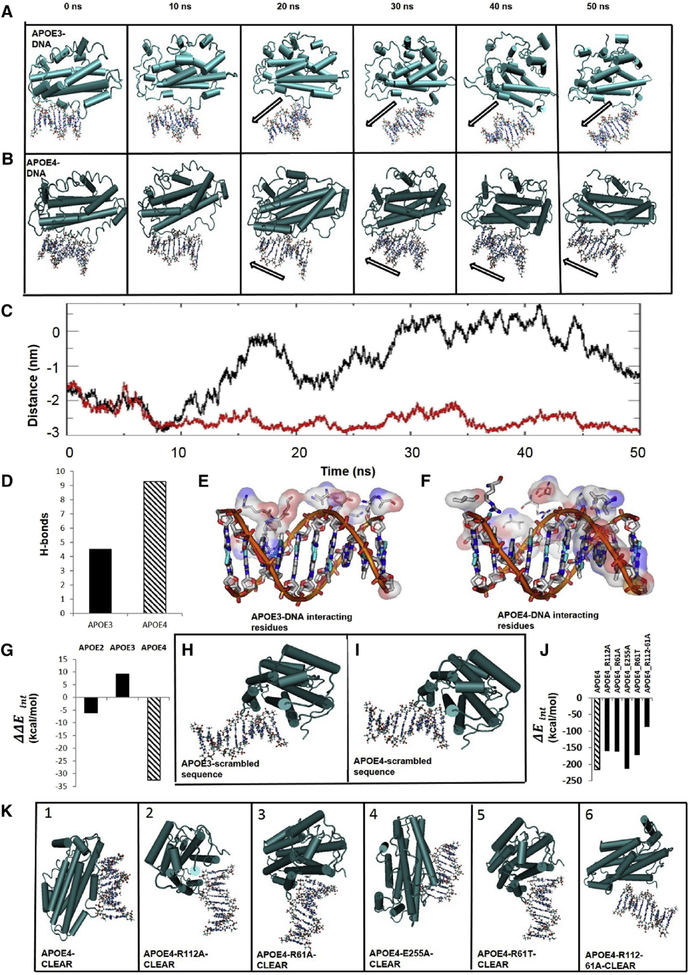
Methods: Autophagic gene expression was assessed in brains of controls and Alzheimer's disease (AD) patients parsed by APOE genotype and in a glioblastoma cell line expressing either apoE3 or apoE4. Computational modeling assessed interactions between apoE and mutated apoE with CLEAR or modified DNA.

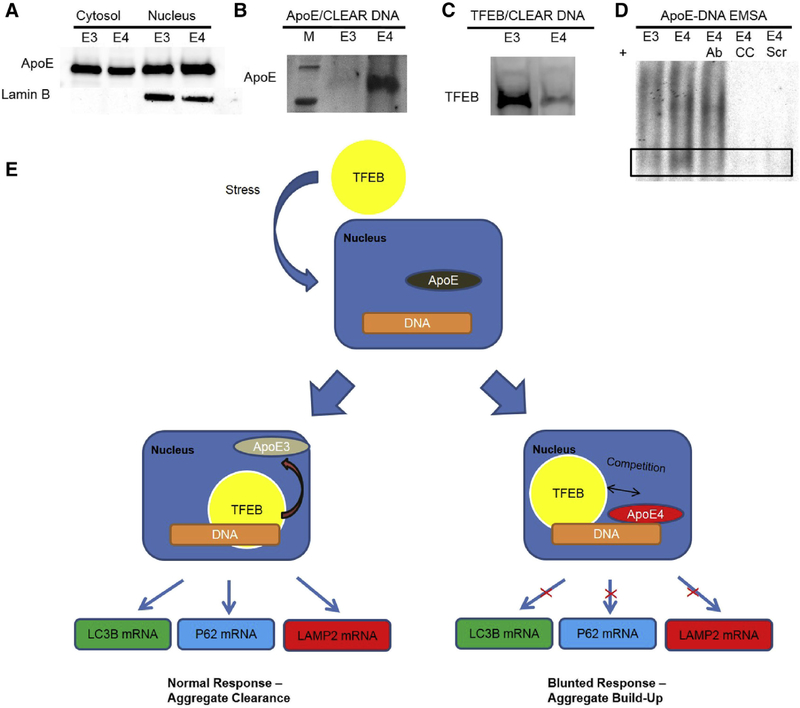
Results: Three TFEB-regulated mRNA transcripts-SQSTM, MAP1LC3B, and LAMP2-were lower in AD ɛ4/ɛ4 than in AD ɛ3/ɛ3 brains. Computational modeling predicted avid specific binding of apoE4 to CLEAR motifs. ApoE was found in cellular nuclei, and in vitro binding assays suggest competition between apoE4 and TFEB at CLEAR sites.

Conclusion: ApoE4-CLEAR interactions may account for suppressed autophagy in APOE ɛ4/ɛ4 carriers and, in this way, contribute to earlier AD onset.

Keywords: APOE genotype; Alzheimer's disease; ApoE protein; DNA binding; EMSA; Molecular-dynamic simulation; PLA; Protein aggregation; TFEB; Transcription; autophagy.


Figures

Fig. 1.
Fig. 1.
AD patients demonstrate elevation of nuclear TFEB in patient carriers of both APOE ε3/ε3 (AD 3,3) and APOE ε4/ε4 (AD 4,4) compared to AMC ε3,3, while mRNAs are elevated only in AD 3,3. (A) Nuclear partitioning of TFEB was assessed by analysis of immunofluorescence histochemistry images of human hippocampal CA1 pyramidal cells in AD and AMC patients. Groups (each n = 4): AMC APOE ε4/ε4; AD 3,3; and AD 4,4 were compared by ANOVA, with Bonferroni-corrected α = 0.0167. AMC 3,3 versus AD 3,3 P = .006; AMC 3,3 versus AD 4,4 P < .01; AD 3,3 versus AD 4,4 P = .33. (B–D) Proximity ligation assay was used to illustrate the AD-related changes in cytoplasmic 14-3-3/TFEB complexes in an AMC patient, an AD 3,3, and an AD 4,4. (E) The relative levels (mRNA/18S) of MAP1LC3B, SQSTM1, and LAMP2 transcripts were determined by real-time RT-PCR in hippocampal specimens from AD and AMC patients, analyzed by disease state and separated by APOE genotype. Histogram shows means ± SEM. Significance of differences from AMC 3,3 (n = 6) was determined by two-tailed t-tests within ANOVA (Bonferroni-adjusted α < 0.02): P = .01 for AD 3,3, n = 5; and P < .01 for AD 4,4, n = 6. Abbreviations: AD, Alzheimer’s disease; AMC, age-matched control; APOE, apolipoprotein E; TFEB, transcription factor EB. *P = .05.
Fig. 2.
Fig. 2.
Aggregate levels, aggregate clearance, and transcription of autophagy mRNAs are apoE isoform dependent. (A) T98G cells stably transfected with either apoE3 (E3) or apoE4 (E4) were incubated for 3 hours in control medium (“Fed”) or a medium lacking nutrients (“Stv”). Aggregates insoluble in 1% sarcosyl were collected by ultracentrifugation, resolved by sodium dodecyl sulfate - polyacrylamide gel electrophoresis, and visualized by SYPRO Ruby. (B) Aggregated proteins in such gels were quantified by densitometry, showing that apoE3 cells had less aggregate protein in the control state than apoE4 cells (**P < .01 by t-test), and that apoE3 cells respond to starvation by increasing clearance of aggregates (**P < .01 by t-test), while apoE4 cells do not. (C) Mitochondrial proteins, preferentially degraded through mitophagy (entailing lysosomal fusion), are enriched in proteomic analysis of sarcosyl-insoluble aggregates isolated from T98G cells expressing apoE4 compared to apoE3. Starvation in apoE3-expressing cells leads to a decrease in these proteins, whereas starvation in apoE4-expressing cells causes further enrichment, implying a defect in lysosomal-stress response. (D) In the fed state, the relative levels of MAP1LC3B, SQSTM1, and LAMP2 mRNAs, assessed by real-time RT-PCR, are similar in apoE3 and apoE4 cells (two-tailed t-test: LC3B, P = .48; SQSTM1, P = .69; LAMP2, P = .82). ApoE3 cells have an approximately 3-fold increased expression during starvation (one-tailed t-test: LC3B, P < .02; SQSTM1, P = .04; LAMP2, P = .04), whereas apoE4 cells are only able to increase expression by approximately 1.5-fold (one-tailed t-test: LC3B, P = .10; SQSTM1, P = .04; LAMP2, P = .02). Abbreviation: ApoE, apolipoprotein E. *P = .05.
Fig. 3.
Fig. 3.
Molecular modeling predicts apoE4, but not apoE3, specifically and preferentially interacts with the CLEAR sequence on dsDNA. Simulations of interactions between apoE and CLEAR dsDNA (GTCACGTGAC), over a 50-ns period, assessed at 10-ns intervals. Interactions are visualized with apoE3 (A) or apoE4 (B) depicted in a “pipes-and-planks” format, and the CLEAR dsDNA depicted in a “ball-and-stick” format. ApoE3-CLEAR dsDNA interactions were unstable or nonexistent (A, black outline arrow; C, black trace) over 50 ns, whereas apoE4-CLEAR dsDNA interactions were early and sustained over the 50-ns period (B, black outline arrow; C, red trace). (C) Center-of-mass distance between the CLEAR sequence and either apoE3 or apoE4 over time. (D) Hydrogen bonds (H-bonds) predicted between the CLEAR sequence and either apoE3 or apoE4. ApoE3 amino-acid residues interact with the sugar-phosphate backbone but not with the base pairs (major and minor grooves) of the CLEAR dsDNA sequence (E), while there are multiple apoE4 amino-acid-residue interactions in grooves of the CLEAR dsDNA (F). (G) ApoE isoform-CLEAR interaction energies minus average interaction energies with non-CLEAR DNA sequences (Supplementary Fig. 6) predict preferential interaction of apoE4 to the CLEAR sequence over and above other DNA sequences. Visualization of interactions between a scrambled dsDNA sequence (Supplementary Fig. 6) and apoE3 (H) or apoE4 (I). Predicted interactions between CLEAR DNA and various missense mutations of apoE4 are represented quantitatively (J) and visually (K). Abbreviations: ApoE, apolipoprotein E; CLEAR, coordinated lysosomal expression and regulation.
Fig. 4.
Fig. 4.
ApoE4-expressing astroglioma cells show more apoE binding and less TFEB binding to CLEAR DNA than apoE3-expressing cells. (A) ApoE is present in the nucleus and the cytosol of apoE-expressing T98G cells. (B) Western-blot analysis of proteins pulled down by binding to CLEAR-motif dsDNA shows elevated apoE4 binding relative to apoE3. (C) ApoE4-expressing cells show less TFEB binding to CLEAR-motif dsDNA relative to cells expressing apoE3. (D) Electrophoretic mobility shift assay (EMSA), in which a 32P-labeled probe containing the CLEAR motif was incubated with 50 ng of recombinant apoE3 (lane 1, “E3”) or apoE4 (lane 2, “E4”) purified from T98G cells and resolved on a nondenaturing gel. ApoE4 was also tested in the presence of 2 μg of antibody to apoE (lane 3, “E4 Ab”), saturating levels of unlabeled CLEAR dsDNA as cold competition (lane 4, “E4 CC”), or a 32P-labeled probe of scrambled sequence (lane 5, E4 scram”), demonstrating sequence specificity for the apoE4 isoform-binding to the CLEAR sequence on dsDNA. (E) Schematic of hypothesized modulation of TFEB-CLEAR interactions by apoE. Stresses, such as starvation as we show in these cells, or other stresses that we postulate in AD, evoke nuclear translocation of TFEB. In apoE3-expressing cells, there is reduced binding of apoE to CLEAR sequences, allowing TFEB greater upregulation of transcription of autophagy genes. Conversely, apoE4 competes with TFEB for CLEAR sequences and thus blunts transcription of autophagy mRNAs. This can predispose cells to proteotoxic damage, activation of inflammatory cytokines, and ultimately to cell death; the first is of particular note in neurons as dysfunctions in autophagy result in buildup of aggregates and formation of paired helical filaments of hyperphosphorylated tau. Abbreviations: AD, Alzheimer’s disease; ApoE, apolipoprotein E; CLEAR, coordinated lysosomal expression and regulation; TFEB, transcription factor EB.

References

    1. Strittmatter WJ, Roses AD. Apolipoprotein E and Alzheimer disease. Proc Natl Acad Sci U S A 1995;92:4725–7. - PMC - PubMed
    1. Roses AD, Saunders AM, Alberts MA, Strittmatter WJ, Schmechel D, Gorder E, et al. Apolipoprotein E E4 allele and risk of dementia. Jama 1995;273:374–5. author reply 5–6. - PubMed
    1. Bertram L, McQueen MB, Mullin K, Blacker D, Tanzi RE. Systematic meta-analyses of Alzheimer disease genetic association studies: the AlzGene database. Nat Genet 2007;39:17–23. - PubMed
    1. Reitz C, Brayne C, Mayeux R. Epidemiology of Alzheimer disease. Nat Rev Neurol 2011;7:137–52. - PMC - PubMed
    1. Riedel BC, Thompson PM, Brinton RD. Age, APOE and sex: triad of risk of Alzheimer’s disease. The J Steroid Biochem Mol Biol 2016; 160:134–47. - PMC - PubMed

Publication types

MeSH terms