. 2017 Sep 23;17(10):2193.
doi: 10.3390/s17102193.

On-Board Detection of Pedestrian Intentions

Affiliations

On-Board Detection of Pedestrian Intentions

Zhijie Fang et al. Sensors (Basel). .

Abstract

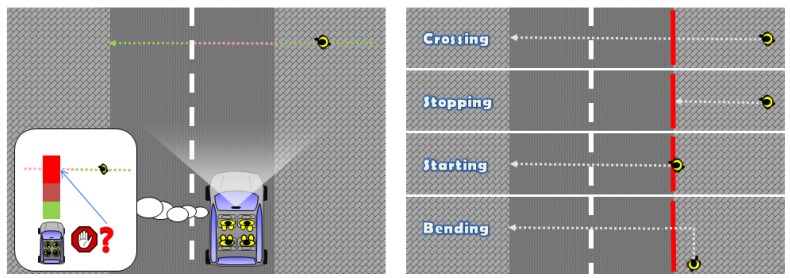
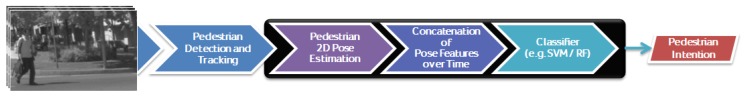
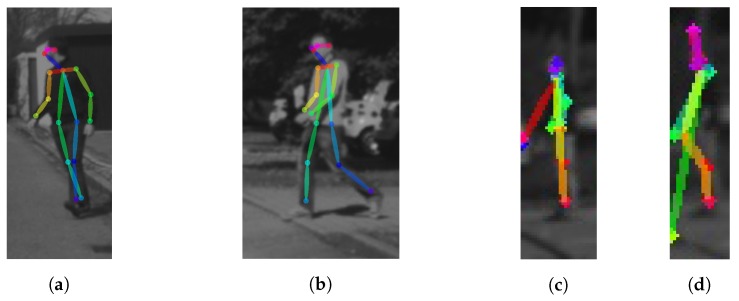
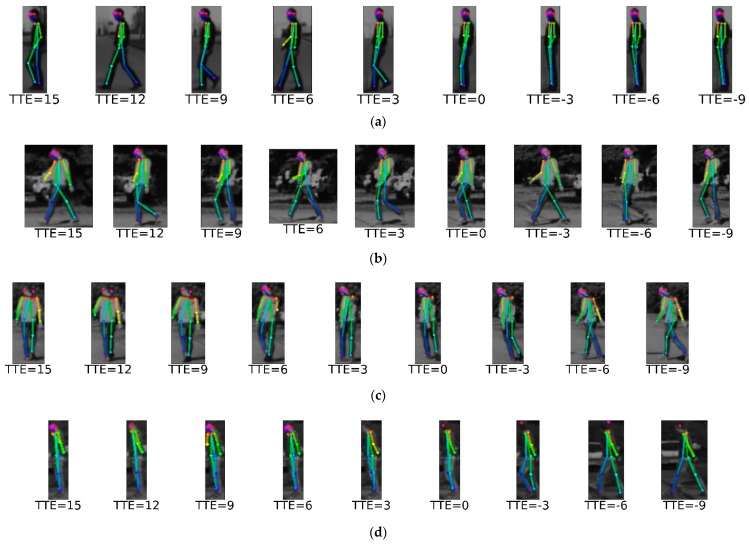
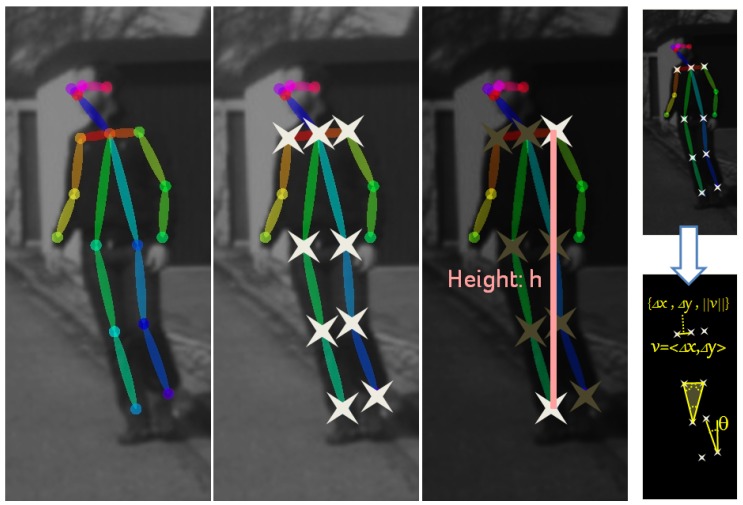
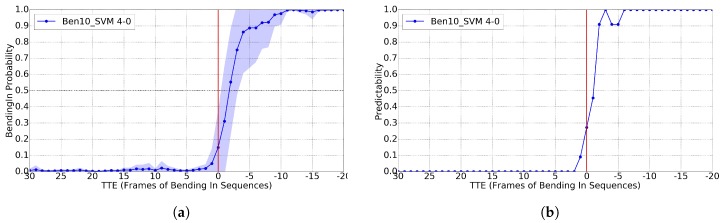
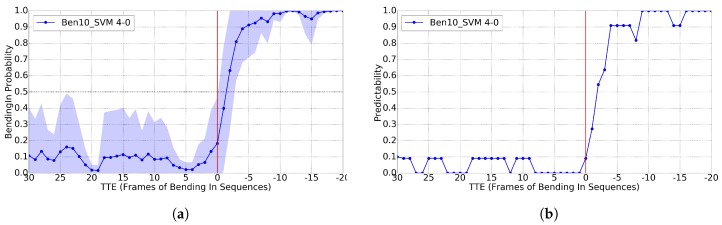
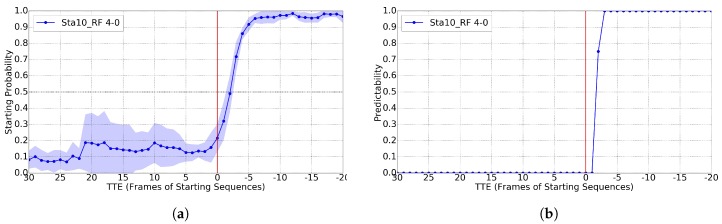
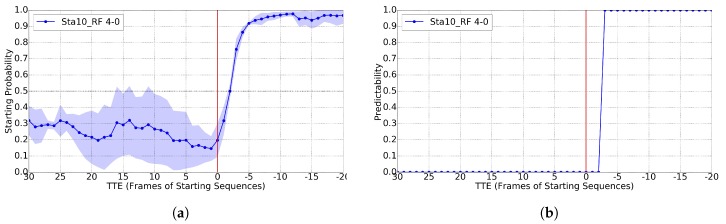
Avoiding vehicle-to-pedestrian crashes is a critical requirement for nowadays advanced driver assistant systems (ADAS) and future self-driving vehicles. Accordingly, detecting pedestrians from raw sensor data has a history of more than 15 years of research, with vision playing a central role. During the last years, deep learning has boosted the accuracy of image-based pedestrian detectors. However, detection is just the first step towards answering the core question, namely is the vehicle going to crash with a pedestrian provided preventive actions are not taken? Therefore, knowing as soon as possible if a detected pedestrian has the intention of crossing the road ahead of the vehicle is essential for performing safe and comfortable maneuvers that prevent a crash. However, compared to pedestrian detection, there is relatively little literature on detecting pedestrian intentions. This paper aims to contribute along this line by presenting a new vision-based approach which analyzes the pose of a pedestrian along several frames to determine if he or she is going to enter the road or not. We present experiments showing 750 ms of anticipation for pedestrians crossing the road, which at a typical urban driving speed of 50 km/h can provide 15 additional meters (compared to a pure pedestrian detector) for vehicle automatic reactions or to warn the driver. Moreover, in contrast with state-of-the-art methods, our approach is monocular, neither requiring stereo nor optical flow information.

Keywords: ADAS; pedestrian intention; self-driving.


Conflict of interest statement

The authors declare no conflict of interest.

Figures

Figure 1
Figure 1
(Left) anticipating as much as possible the intentions of a pedestrian allows for safer and more comfortable maneuvers. For instance, we would like to know if the pedestrian is going to enter the road while walking towards it from the sidewalk; or, in general, if it is going to enter a critical area that the ego-vehicle can compute as its predicted driving path; (Right) different situations taking the curbside (red line) as Reference [12]. From top to bottom: a pedestrian will be crossing the road without stopping; a pedestrian walking towards the road will be stopping at the curbside; a pedestrian that was stopped at the curbside is starting to walk for entering the road; a pedestrian walking parallel to the curbside (parallel to the trajectory of the ego-vehicle) will be bending towards the road. Here, we plot the pedestrian walking away from the ego-vehicle, but walking towards the ego-vehicle and bending would fall in the same category.
Figure 2
Figure 2
Proposed method. Monocular frames are continuously acquired and processed for detecting and tracking pedestrians. For each tracked pedestrian, our proposal consists of: estimating his or her 2D pose by skeleton fitting, computing features from the fitted skeleton; input them to a learned classifier, which will output the intention of the pedestrian.
Figure 3
Figure 3
2D pose estimation, i.e., 2D skeleton fitting, at increasing pedestrian-vehicle distances. (a) 13 m; (b) 18 m; (c) 40 m; (d) 45 m.
Figure 4
Figure 4
Skeleton fitting for the four situations considered in this paper. We show a sequence for each situation. TTE stands for time to event. TTE = 0 is when the event of interest happens: stopping at the curbside, crossing the curbside, bending, and starting to walk from the curbside. Positive TTE values correspond to frames before the event, negative values to frames after the event. (a) stopping; (b) crossing; (c) bending; (d) starting.
Figure 5
Figure 5
Skeleton fitting is based on 18 keypoints, distinguishing left and right arms and legs [18]. We use the nine keypoints highlighted with stars. The upper keypoint among those and the lower are used to compute height h, which is used as scaling factor for normalizing the keypoint coordinates. Then, using the normalized keypoints, different features based on relative angles and distances are computed as features. For instance, to the right, we see several examples: (1) distance in the x (column) and y (row) axes and Euclidean distance between two keypoints (Δx, Δy, v); (2) angle between two keypoints (θ); (3) the three angles of a triangle formed by three keypoints. After normalizing by h these seven values, they become components of the feature vector ψi of frame i. Computing similar values by taking into account all the keypoints we complete ψi.
Figure 6
Figure 6
Results for the crossing vs. stopping classification task (Cc), using GT (ground truth) pedestrian BBs (Bounding Box), a time sliding window of 10, the RBF-SVM classifier and 16–8 as a trade-off for setting positive and negative frames during training. ’Cro’ curve means applied to testing sequences of crossing, ’Sto’ curve means applied to testing sequences of stopping. Note that the frames from the stopping sequences are rightly classified if Cc>0.20, while for the crossing sequences those are the wrongly classified. (a) classification probability (mean as curves, standard deviation as colored areas); (b) predictability for Cc with threshold 0.20.
Figure 7
Figure 7
Analogous to Figure 6, but using the BBs of the provided pedestrian detections. (a) classification probability; (b) predictability for Cc>0.20.
Figure 8
Figure 8
Classification probability for several temporal sliding windows (T{1,4,7}) applied to stopping and crossing sequences. (a) stopping sequences; (b) crossing sequences.
Figure 9
Figure 9
Results for the bending classification task (Cb), using GT pedestrian BBs, a time sliding window of 10, the RBF-SVM classifier and 4-0 as trade off for setting positive and negative frames during training. ’Ben’ curve means applied to testing bending sequences. (a) classification probability; (b) predictability for Cb>0.16.
Figure 10
Figure 10
Analogous to Figure 9, but using the BBs of the provided pedestrian detections. (a) classification probability; (b) predictability for Cb>0.80.
Figure 11
Figure 11
Results for the starting classification task (Cs), using GT pedestrian BBs, a time sliding window of 10, the RF classifier and 4-0 as trade off for setting positive and negative frames during training. ’Sta’ curve means applied to testing starting sequences. (a) classification probability; (b) predictability for Cs>0.50.
Figure 12
Figure 12
Analogous to Figure 11, but using the BBs of the provided pedestrian detections. (a) classification probability; (b) predictability for Cs>0.60.

References

    1. Gerónimo D., López A. Vision-Based Pedestrian Protection Systems for Intelligent Vehicles. Springer; New York, NY, USA: 2014.
    1. Ren J., Chen X., Liu J., Sun W., Pang J., Yan Q., Tai Y., Xu L. Accurate Single Stage Detector Using Recurrent Rolling Convolution; Proceedings of the Conference on Computer Vision and Pattern Recognition (CVPR); Honolulu, HI, USA. 21–26 July 2017.
    1. Franke U. Computer Vision in Vehicle Technology: Land, Sea, and Air. Wiley; Hoboken, NJ, USA: 2017. Chapter Autonomous Driving.
    1. Enzweiler M., Gavrila D. Monocular Pedestrian Detection: Survey and Experiments. IEEE Trans. Pattern Anal. Mach. Intell. 2009;31:2179–2195. doi: 10.1109/TPAMI.2008.260. - DOI - PubMed
    1. Dollár P., Wojek C., Schiele B., Perona P. Pedestrian Detection: An Evaluation of the State of the Art. IEEE Trans. Pattern Anal. Mach. Intell. 2012;34:743–761. doi: 10.1109/TPAMI.2011.155. - DOI - PubMed