

Metabolic adjustment upon repetitive substrate perturbations using dynamic 13C-tracing in yeast
- PMID: 28946905
- PMCID: PMC5613340
- DOI: 10.1186/s12934-017-0778-6
Metabolic adjustment upon repetitive substrate perturbations using dynamic 13C-tracing in yeast
Abstract
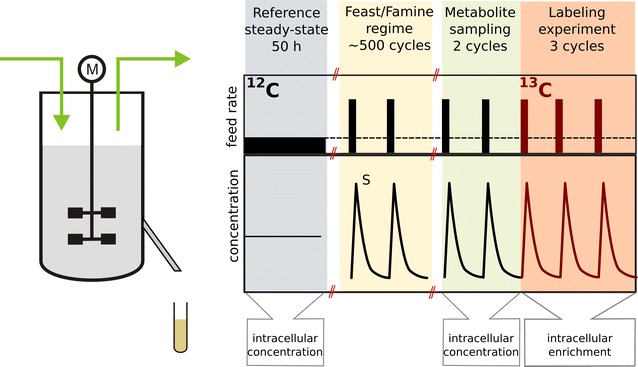
Background: Natural and industrial environments are dynamic with respect to substrate availability and other conditions like temperature and pH. Especially, metabolism is strongly affected by changes in the extracellular space. Here we study the dynamic flux of central carbon metabolism and storage carbohydrate metabolism under dynamic feast/famine conditions in Saccharomyces cerevisiae.
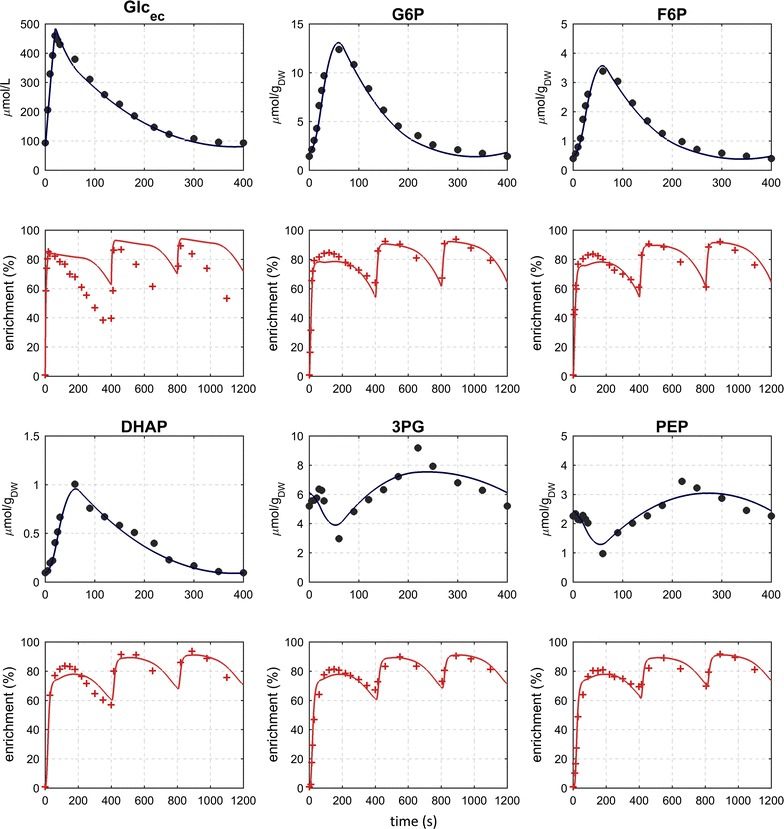
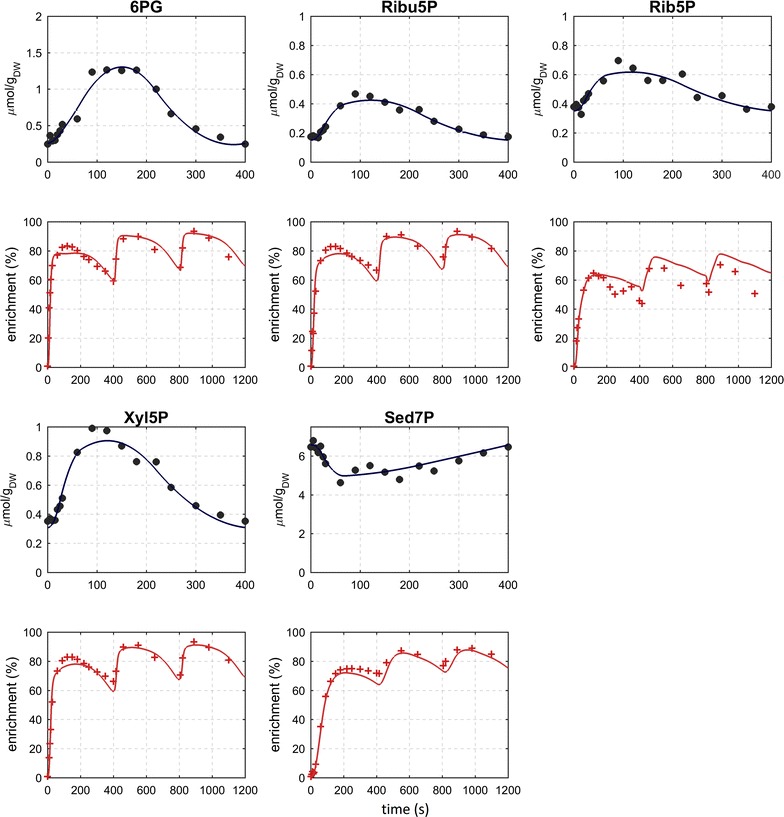
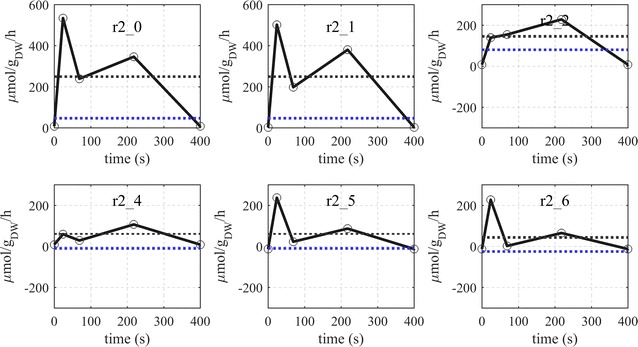
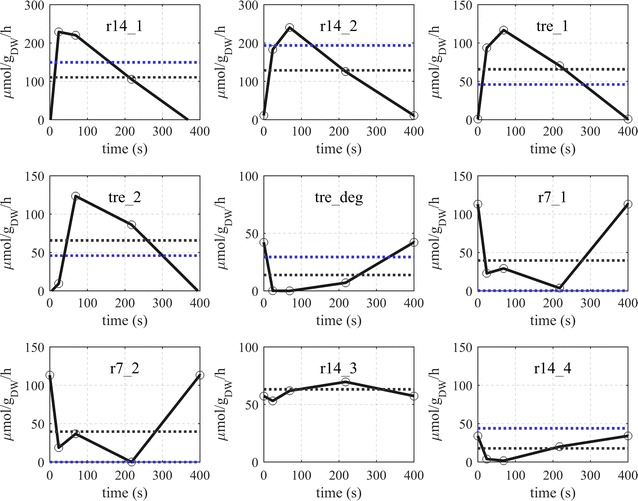
Results: The metabolic flux reacts fast and sensitive to cyclic perturbations in substrate availability. Compared to well-documented stimulus-response experiments using substrate pulses, different metabolic responses are observed. Especially, cells experiencing cyclic perturbations do not show a drop in ATP with the addition of glucose, but an immediate increase in energy charge. Although a high glycolytic flux of up to 5.4 mmol g DW-1 h-1 is observed, no overflow metabolites are detected. From famine to feast the glucose uptake rate increased from 170 to 4788 μmol g DW-1 h-1 in 24 s. Intracellularly, even more drastic changes were observed. Especially, the T6P synthesis rate increased more than 100-fold upon glucose addition. This response indicates that the storage metabolism is very sensitive to changes in glycolytic flux and counterbalances these rapid changes by diverting flux into large pools to prevent substrate accelerated death and potentially refill the central metabolism when substrates become scarce. Using 13C-tracer we found a dilution in the labeling of extracellular glucose, G6P, T6P and other metabolites, indicating an influx of unlabeled carbon. It is shown that glycogen and trehalose degradation via different routes could explain these observations. Based on the 13C labeling in average 15% of the carbon inflow is recycled via trehalose and glycogen. This average fraction is comparable to the steady-state turnover, but changes significantly during the cycle, indicating the relevance for dynamic regulation of the metabolic flux.
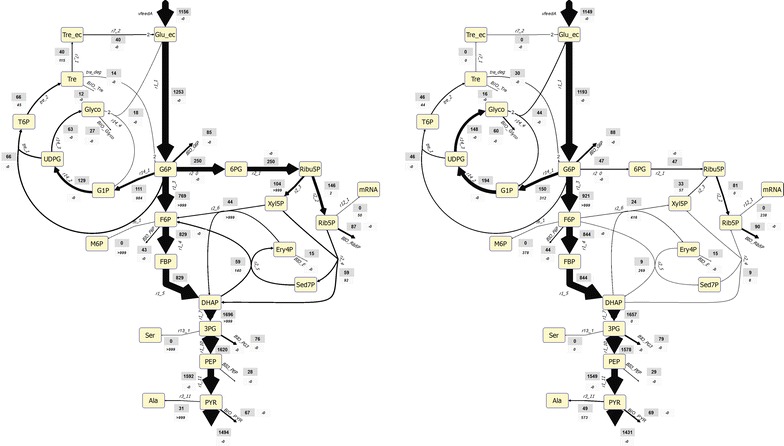
Conclusions: Comparable to electric energy grids, metabolism seems to use storage units to buffer peaks and keep reserves to maintain a robust function. During the applied fast feast/famine conditions about 15% of the metabolized carbon were recycled in storage metabolism. Additionally, the resources were distributed different to steady-state conditions. Most remarkably is a fivefold increased flux towards PPP that generated a reversed flux of transaldolase and the F6P-producing transketolase reactions. Combined with slight changes in the biomass composition, the yield decrease of 5% can be explained.
Keywords: 13C labeling; Dynamic fluxes; Metabolomics; Multiple perturbations; Storage carbohydrates; Systems biology; Yeast.
Figures


Similar articles
-
Dynamic 13C-tracer study of storage carbohydrate pools in aerobic glucose-limited Saccharomyces cerevisiae confirms a rapid steady-state turnover and fast mobilization during a modest stepup in the glucose uptake rate.FEMS Yeast Res. 2009 Mar;9(2):191-201. doi: 10.1111/j.1567-1364.2008.00465.x. FEMS Yeast Res. 2009. PMID: 19220865
-
Flux response of glycolysis and storage metabolism during rapid feast/famine conditions in Penicillium chrysogenum using dynamic (13)C labeling.Biotechnol J. 2014 Mar;9(3):372-85. doi: 10.1002/biot.201200260. Epub 2013 Dec 4. Biotechnol J. 2014. PMID: 24376125
-
Interaction of storage carbohydrates and other cyclic fluxes with central metabolism: A quantitative approach by non-stationary 13C metabolic flux analysis.Metab Eng Commun. 2016 Jan 22;3:52-63. doi: 10.1016/j.meteno.2016.01.001. eCollection 2016 Dec. Metab Eng Commun. 2016. PMID: 29468113 Free PMC article.
-
Reserve carbohydrates metabolism in the yeast Saccharomyces cerevisiae.FEMS Microbiol Rev. 2001 Jan;25(1):125-45. doi: 10.1111/j.1574-6976.2001.tb00574.x. FEMS Microbiol Rev. 2001. PMID: 11152943 Review.
-
The benefits of being transient: isotope-based metabolic flux analysis at the short time scale.Appl Microbiol Biotechnol. 2011 Sep;91(5):1247-65. doi: 10.1007/s00253-011-3390-4. Epub 2011 Jul 6. Appl Microbiol Biotechnol. 2011. PMID: 21732247 Review.
Cited by
-
Predicting Metabolic Adaptation Under Dynamic Substrate Conditions Using a Resource-Dependent Kinetic Model: A Case Study Using Saccharomyces cerevisiae.Front Mol Biosci. 2022 May 16;9:863470. doi: 10.3389/fmolb.2022.863470. eCollection 2022. Front Mol Biosci. 2022. PMID: 35651815 Free PMC article.
-
Using Kinetic Modelling to Infer Adaptations in Saccharomyces cerevisiae Carbohydrate Storage Metabolism to Dynamic Substrate Conditions.Metabolites. 2023 Jan 5;13(1):88. doi: 10.3390/metabo13010088. Metabolites. 2023. PMID: 36677014 Free PMC article.
-
Monitoring Intracellular Metabolite Dynamics in Saccharomyces cerevisiae during Industrially Relevant Famine Stimuli.Metabolites. 2022 Mar 18;12(3):263. doi: 10.3390/metabo12030263. Metabolites. 2022. PMID: 35323706 Free PMC article.
-
Kinetic Modeling of Saccharomyces cerevisiae Central Carbon Metabolism: Achievements, Limitations, and Opportunities.Metabolites. 2022 Jan 13;12(1):74. doi: 10.3390/metabo12010074. Metabolites. 2022. PMID: 35050196 Free PMC article. Review.
-
Construction of an alternative NADPH regeneration pathway improves ethanol production in Saccharomyces cerevisiae with xylose metabolic pathway.Synth Syst Biotechnol. 2024 Feb 28;9(2):269-276. doi: 10.1016/j.synbio.2024.02.004. eCollection 2024 Jun. Synth Syst Biotechnol. 2024. PMID: 38469586 Free PMC article.
References
-
- Aboka FO, Heijnen JJ, Van Winden WA. Dynamic 13C-tracer study of storage carbohydrate pools in aerobic glucose-limited Saccharomyces cerevisiae confirms a rapid steady-state turnover and fast mobilization during a modest stepup in the glucose uptake rate. FEMS Yeast Res. 2009;9:191–201. doi: 10.1111/j.1567-1364.2008.00465.x. - DOI - PubMed
MeSH terms
Substances
LinkOut - more resources
Full Text Sources
Other Literature Sources
Molecular Biology Databases
