. 2017 Nov 15;431(2):179-193.
doi: 10.1016/j.ydbio.2017.09.024. Epub 2017 Sep 22.

Autonomous and non-autonomous roles for ephrin-B in interneuron migration

Affiliations

Autonomous and non-autonomous roles for ephrin-B in interneuron migration

Asghar Talebian et al. Dev Biol. .

Abstract

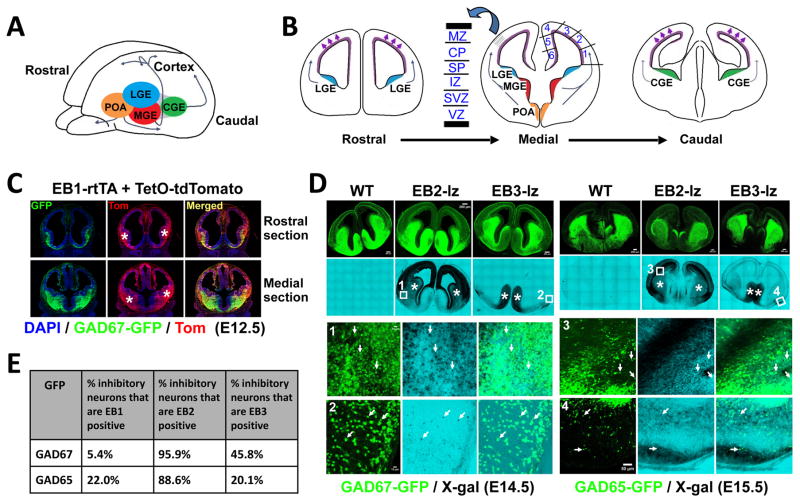
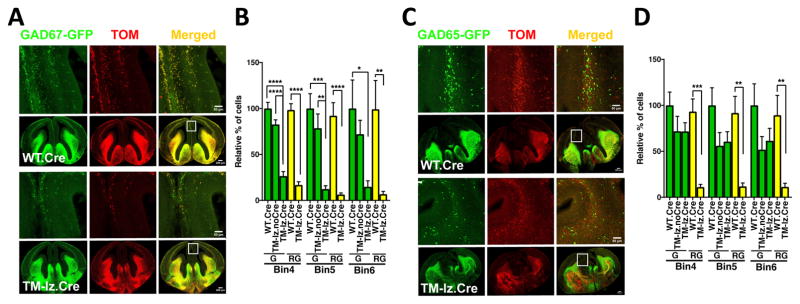
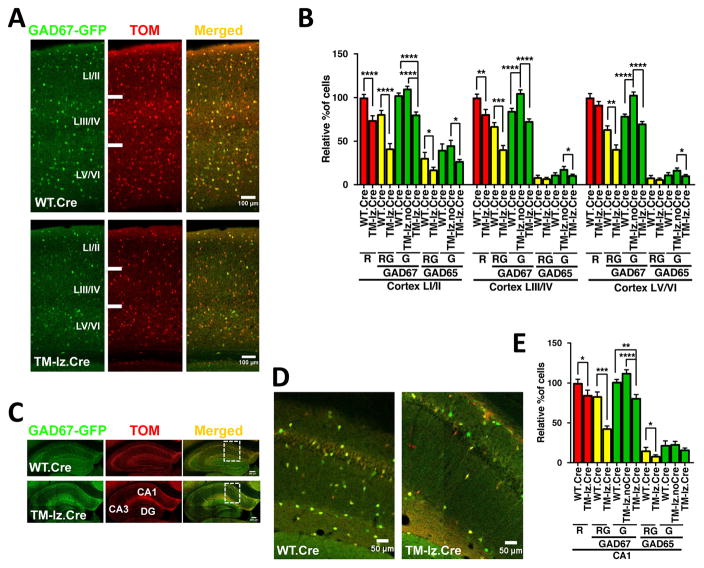
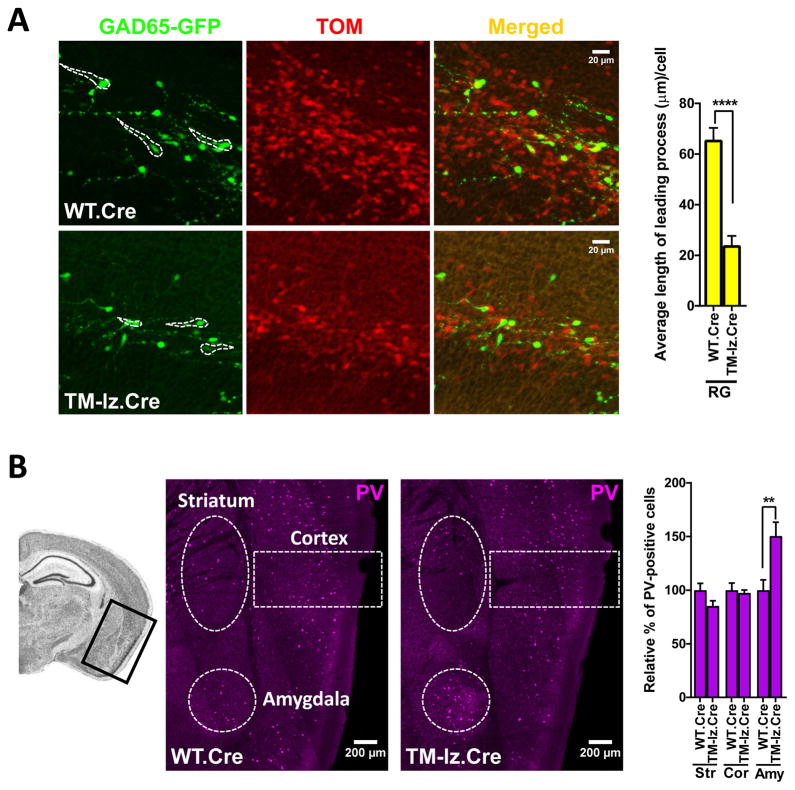
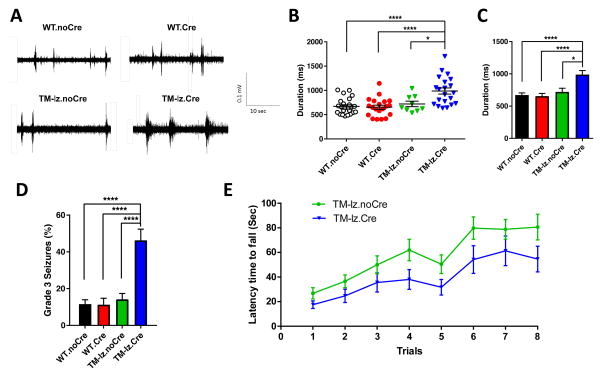
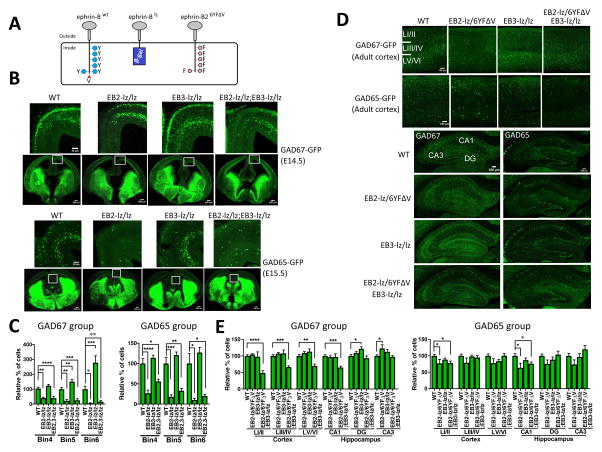
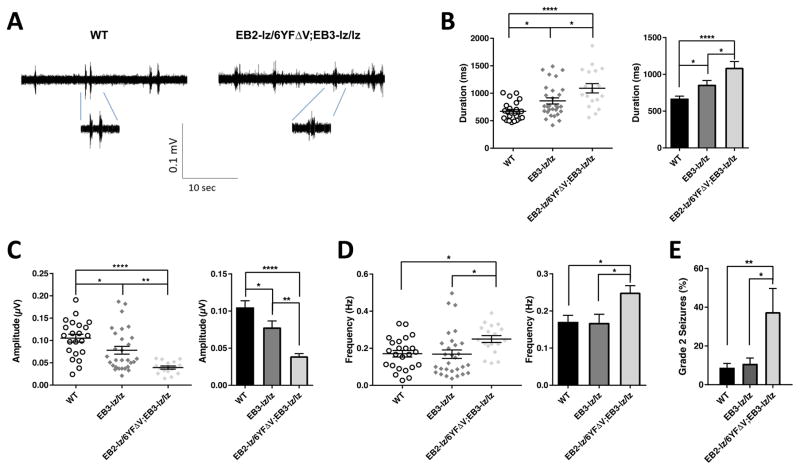
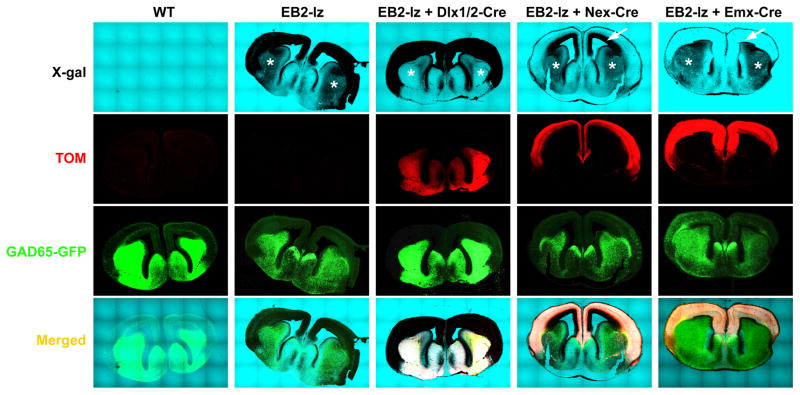
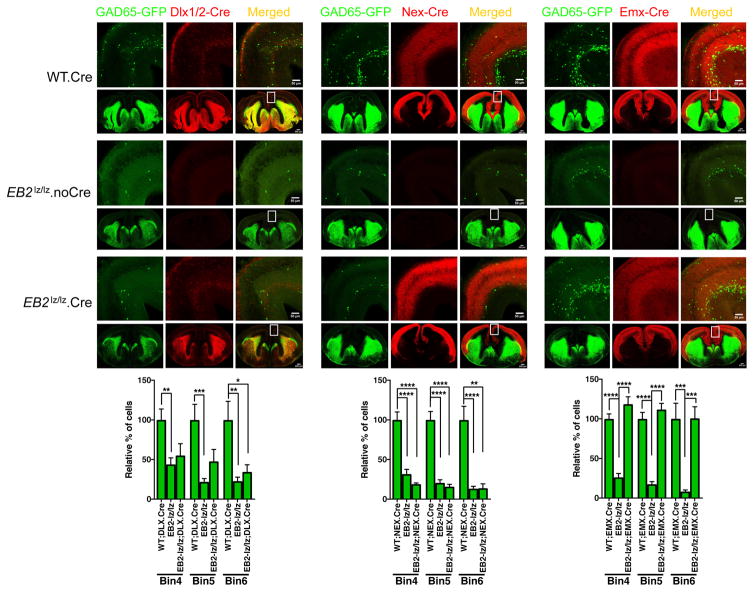
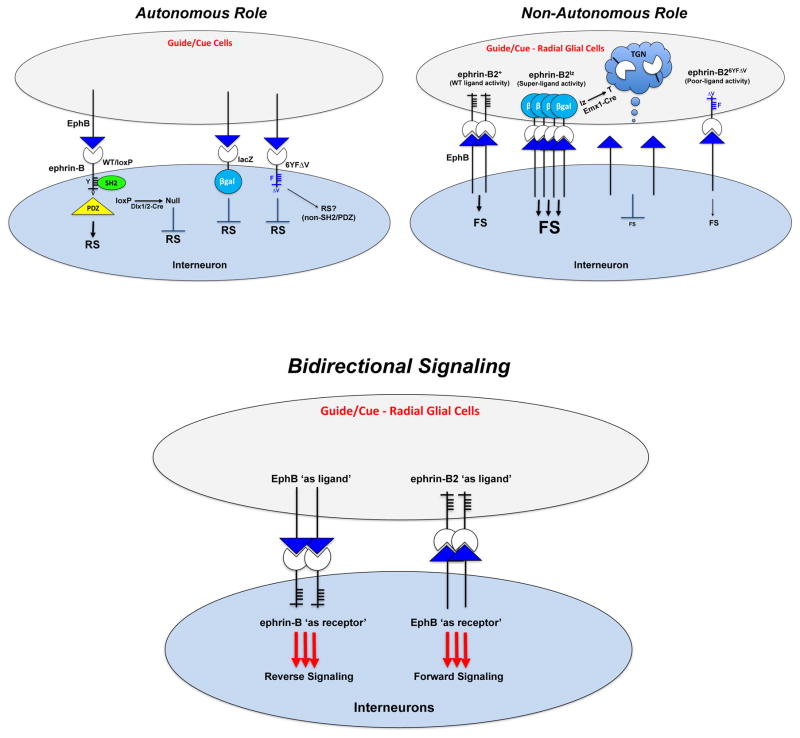
While several studies indicate the importance of ephrin-B/EphB bidirectional signaling in excitatory neurons, potential roles for these molecules in inhibitory neurons are largely unknown. We identify here an autonomous receptor-like role for ephrin-B reverse signaling in the tangential migration of interneurons into the neocortex using ephrin-B (EfnB1/B2/B3) conditional triple mutant (TMlz) mice and a forebrain inhibitory neuron specific Cre driver. Inhibitory neuron deletion of the three EfnB genes leads to reduced interneuron migration, abnormal cortical excitability, and lethal audiogenic seizures. Truncated and intracellular point mutations confirm the importance of ephrin-B reverse signaling in interneuron migration and cortical excitability. A non-autonomous ligand-like role was also identified for ephrin-B2 that is expressed in neocortical radial glial cells and required for proper tangential migration of GAD65-positive interneurons. Our studies thus define both receptor-like and ligand-like roles for the ephrin-B molecules in controlling the migration of interneurons as they populate the neocortex and help establish excitatory/inhibitory (E/I) homeostasis.

Keywords: Bidirectional signaling; EphB; Ephrin-B; Excitatory/inhibitory homeostasis; Inhibitory interneuron migration.


Figures

Fig. 1
Fig. 1. Ephrin-B (EB) expression in inhibitory neurons in the developing forebrain
(A) Interneurons originate from the ganglionic eminences (GE) and preoptic area (POA) and follow tangential migration pathways to populate the neocortex (thin arrows); lateral GE (LGE; blue color), medial GE (MGE; red color), and caudal GE (CGE; green color). (B) Schematics of coronal sections at embryonic age detailing the bins 1–6 used to quantify interneuron migration into defined neocortical regions. Excitatory neurons born in the VZ (indicated in purple color) migrate along radial glial cells to form defined cortical layers, the marginal zone (MZ), cortical plate (CP), subplate (SP), intermediate zone (IZ), subventricular zone (SVZ), and ventricular zone (VZ). Inhibitory neurons migrate into the neocortex (thin arrows) by interacting with the layered excitatory neurons and radial glia, forming layer-specific streams that extend into the developing cortex and hippocampus. (C) Ephrin-B1 (EB1) expression at E12.5 was visualized using a dox-inducible EB1-rtTA BAC transgene and a TetO-tdTomato indicator (Tom, red fluorescence) combined with a GAD67-GFP reporter (green fluorescence). EB1 is expressed in the the GEs (asterisks) and neocortex with clear overlap in GAD67-GFP positive inhibitory neurons in the ventral forebrain (yellow fluorescence in merged images). Dox-containing chow and drinking water was provided to timed-pregnant females 2 days prior to collection of embryos. No tdTomato red fluorescence was detected in the absence of dox treatment (not shown). (D) Ephrin-B2 (EB2) and ephrin-B3 (EB3) expression at E14.5 and E15.5 was detected using EB2lz and EB3lz mutations which express C-terminal truncated EB2-βgal and EB3-βgal fusion proteins that can be visualized using X-gal stain (black color in bright field) in combination with GAD67-GFP at E14.5 or GAD65-GFP at E15.5 (green fluorescence in confocal). EB2 is expressed in the GEs (asterisks), VZ, and neocortex (predominantly between the IZ and CP as well as outer MZ), while EB3 is strongly expressed in the ventral/medial forebrain (predominantly in the POA, indicated by asterisks) and the GEs. Numbered boxes indicate location of enlarged images with arrows identifing inhibitory neurons co-expressing EB2 or EB3 with GAD-GFP in the individual confocal (GFP fluorescence), bright-field (X-gal stain), and merged images. No X-gal stain was detected in sections from WT brains. (E) Quantification of EB1, EB2, and EB3 expressing cells in GAD67-GFP and GAD65-GFP inhibitory neurons obtained from short-term primary embryonic neuron cultures.
Fig. 2
Fig. 2. Conditional deletion of ephrin-B in TMlz triple mutants using an inhibitory neuron specific Dlx1/2-Cre driver leads to reduced populations of interneurons in the embryonic neocortex
(A) Representative confocal images of GAD67-GFP labeled interneurons in the neocortex at age E14.5 in Dlx1/2-Cre containing wild-type (WT.Cre) and TMlz (TM-lz.Cre) brains. The boxed regions in the low magnification images indicate location of the high magnification images, with isolated GAD67-GFP reporter (green fluorescence), Rosa26-STOP-tdTomato indicator (Tom, red fluorescence), and merged signals to identify those cells co-labeled with GFP and Tom (yellow). (B) Quantification of the number of GAD67-GFP interneurons in the neocortex at E14.5 within bins 4–6 of coronal sections from Dlx1/2-Cre-positive TMlz animals (TM-lz.Cre) compared to Cre-negative TMlz (TM-lz.noCre) littermates and Cre-positive WT animals (WT.Cre). Total GAD67-GFP-positive cells (G) and number of green cells that were also exposed to Cre (red+green cells, RG) were counted and proportionally compared to the WT.Cre brains. N values for embryonic brain hemispheres: WT.Cre (6), TM-lz.noCre (8), and TM-lz.Cre (8); mean ± s.e.m.; one-way ANOVA (post-hoc Tukey test); * P< 0.05, ** P< 0.01, *** P<0.001, **** P<0.0001. (C) Representative confocal images of GAD65-GFP labeled interneurons in the neocortex at age E15.5 in Dlx1/2-Cre containing WT and TM-lz brains. The boxed regions in the low magnification images indicate location of the high magnification images, with GAD65-GFP reporter (green), Tom indicator (red), and merged signals (yellow). (D) Quantification of the number of GAD65-GFP interneurons in the neocortex at E15.5 within bins 4–6 of coronal sections from TM-lz.Cre animals compared to TM-lz.noCre littermates and WT.Cre animals. Total GAD65-GFP-positive cells (G) and number of green cells that were also exposed to Cre (red+green cells, RG) were counted and proportionally compared to the WT.Cre brains. N values for embryonic brain hemispheres: WT.Cre (8), TM-lz.noCre (6), and TM-lz.Cre (6); mean ± s.e.m.; one-way ANOVA (post-hoc Tukey test); * P< 0.05, ** P< 0.01, *** P<0.001, **** P<0.0001.
Fig. 3
Fig. 3. Conditional deletion of ephrin-B in TMlz triple mutants using an inhibitory neuron specific Dlx1/2-Cre driver results in reduced populations of interneurons in the cortex and CA1 hippocampal region of the adult brain
(A) Representative confocal images of GAD67-GFP (green) and Dlx1/2-Cre exposed (red) interneurons in WT.Cre and TM-lz.Cre adult mice (>P90) in coronal sections of the cortex. The merged images show that most all GAD67-GFP labeled interneurons were exposed to Cre (yellow). (B) Quantification of the Dlx1/2-Cre exposed interneurons (red, R), GAD67-GFP or GAD65-GFP expressing interneurons (green, G), and of Cre-exposed cells that also express the corresponding GFP reporter (red+green cells, RG) was determined by counting cells in defined cortex layers I/II, III/IV, V/VI from WT.Cre, TM-lz.noCre, and TM-lz.Cre brains. (C) Representative confocal images of GAD67-GFP (green) and Dlx1/2-Cre exposed (red) interneurons in WT.Cre and TM-lz.Cre adult mice (>P90) in coronal sections of the hippocampal dentate gyrus (DG), CA3, and CA1 regions. (D) High magnification merged images of the CA1 region boxed in C showing reduced numbers of interneurons in TM-lz.Cre brains. (E) Quantification of reduced GAD67-GFP and GAD65-GFP interneuron populations in Dlx1/2-Cre exposed brains in CA1 region of the hippocampus. N values for GAD67-GFP adult brain hemispheres are: WT.Cre (18), TM-lz.noCre (16), and TM-lz.Cre (6); for GAD65-GFP: WT.Cre (10), TM-lz.noCre (8), and TM-lz.Cre (16); mean ± s.e.m.; one-way ANOVA (post-hoc Tukey test); * P< 0.05, ** P< 0.01, *** P<0.001, **** P<0.0001.
Fig. 4
Fig. 4. Inhibitory neuron deletion of ephrin-B affects the length of the leading process in migrating interneurons and results in accumulation of interneurons in lateral regions of the cortex
(A) The length of the leading cell process of Dlx1/2-Cre-exposed GAD65-GFP cells (red+green, RG) was determined in bins 2–3 of coronal sections from WT.Cre and TM-lz.Cre embryos collected at E15.5. Shown are representative confocal images with identified RG cells outlined in white dashed lines and bar graph shows quantification of the data. N values for embryonic brain hemispheres are: WT.Cre (8 brains – 435 cells analyzed) and TM-lz.Cre (6 brains – 114 cells analyzed). (B) PV-positive cells were counted in lateral regions of the cortex and striatum from coronal sections of adult brains. Dash lines represent areas that were counted in the striatum (Str, 0.4 mm2), entorhinal/perirhinal cortex (Cor, 0.5 mm2), and amygdala (Amy, 0.2 mm2). N values for adult brain hemispheres are: WT.Cre (12) and TM-lz.Cre. (8); mean ± s.e.m.; t-test, two-tail ed; ** P< 0.01, **** P<0.0001.
Fig. 5
Fig. 5. Inhibitory neuron deletion of ephrin-B leads to longer duration cortical UP states, lethal audiogenic seizures, and poor motor coordination
(A–C) Electrophysiological recordings of brain slices obtained at P20–24 were used to assess the spontaneous intrinsic activity of cortical neural networks in layer IV of the somatosensory cortex. Shown are representative traces of UP state duration for each genotype (A), a scatter plot of the data (B), and bar graph summary (C). N values: WT.noCre (6 brains – 24 slices), WT.Cre (6 brains – 20 slices), TM-lz.noCre (2 brains – 9 slices), and TM-lz.Cre (5 brains – 21 slices); mean ± s.e.m.; one-way ANOVA (post-hoc Tukey test); * P< 0.05, **** P<0.0001. (D) Animals were assessed for susceptibility to audiogenic seizures at age P20–24 by exposing to a loud sound (110 dB) for 3.5 minutes and scoring for abnormal seizure-related phenotypes on the following scale: 0 = no response; 1 = wild running; 2 = tonic-clonic seizures; 3 = status epilepticus and death. N values: WT.noCre (190), WT.Cre (80), TM-lz.noCre (120), and TM-lz.Cre (67); mean ± s.e.m.; Fisher’s exact test; **** P<0.0001. (E) Dlx1/2-Cre-positive TM-lz mice exhibited a trend towards decreased rotarod performance compared to control Cre-negative TM-lz littermates, although the differences did not reach a level of significance. Adult mice were assessed at age >P90. N values: TM-lz.noCre (24) and TM-lz.Cre (20); mean ± s.e.m.; t-test, two-tailed.
Fig. 6
Fig. 6. Intracellular ephrin-B truncation and point mutations disrupt interneuron migration and population into the cortex and hippocampus
(A) Schematic diagrams of EBwt (WT), EBlz (EB-lz), and EB26YFΔV (EB2-6YFΔV) mutations used in the analysis. (B) Representative high and low magnification confocal images of embryonic brains containing GAD67-GFP at E14.5 (upper panels) or GAD65-GFP at E15.5 (lower panels) visualizing interneurons from WT, EB2-lz/lz single mutant, EB3-lz/lz single mutant, and EB2-lz/lz;EB3-lz/lz double mutant. (C) Quantification of GAD67-GFP cells from E14.5 embryos (left side) and GAD65-GFP cells from E15.5 embryos (right side) populating bins 4, 5, and 6. N values for GAD67 embryonic brain hemispheres: WT (26), EB2-lz/lz (6), EB3-lz/lz (24), EB2-lz/lz;EB3-lz/z (14); and for GAD65: WT (22), EB2-lz/lz (6), EB3-lz/lz (20), and EB2-lz/lz;EB3-lz/lz (10); mean ± s.e.m.; one-way ANOVA (post-hoc Tukey test); * P< 0.05, ** P< 0.01, *** P<0.001, **** P<0.0001; or t-test (two-tailed, unpaired) * P< 0.05. (D) Representative confocal images of adult cortex (upper panels) and hippocampus (lower panels) of WT, EB2-lz/6YFΔV single mutants, EB3-lz/lz single mutants, and EB2-lz/6YFΔV;EB3-lz/lz double mutants in GAD67-GFP and GAD65-GFP cell populations. (E) Quantification of interneuron cell populations. N values for GAD67 adult brain hemispheres are: WT (18), EB2-lz/6YFΔV (8), EB3-lz/lz (8), and EB2-lz/6YFΔV;EB3-lz/lz (6); and for GAD65: WT (24), EB2-lz/6YFΔV (8), EB3-lz/lz (14) and EB2-lz/6YFΔV;EB3-lz/lz (10); mean ± s.e.m.; one-way ANOVA (post-hoc Tukey test); * P< 0.05, ** P< 0.01, *** P<0.001, **** P<0.0001; or t-test (two-tailed, unpaired) * P< 0.05.
Fig. 7
Fig. 7. Intracellular ephrin-B truncation and point mutations leads to altered cortical UP states and increased non-lethal audiogenic seizures
(A–D) Electrophysiological recordings of brain slices obtained at P20–24 were used to assess the spontaneous intrinsic activity of cortical neural networks in layer IV of the somatosensory cortex. Shown are representative traces of UP states for indicated genotypes (A) and scatter plots of the data and bar graph summaries of the UP state duration (B), amplitude (C), and frequency (D). N values: WT (6 brains – 24 slices), EB3-lz/lz single mutant (4 brains – 29 slices), and EB2-lz/6YFΔV;EB3-lz/lz double mutant (2 brains – 18 slices); mean ± s.e.m.; one-way ANOVA (post-hoc Tukey test); * P< 0.05, ** P< 0.01, *** P< 0.001, **** P<0.0001. (E) EB2-lz/6YFΔV;EB3-lz/lz double mutant mice assessed at age P20–24 exhibited a significant increase in grade 2 audiogenic seizures compared to control EB3-lz/lz single mutant littermates and WT mice. N values: WT (160), EB3-lz/lz (111), and EB2-lz/6YFΔV;EB3-lz/lz (16); mean ± s.e.m.; Fisher’s exact test; * P< 0.05, ** P< 0.01, **** P<0.0001.
Fig. 8
Fig. 8. Dlx1/2-Cre, Nex-Cre, and Emx1-Cre drivers delete expression of the EB2-lz-encoded EB2-βgal fusion protein in select cell populations in the embryonic forebrain
Images of WT or EB2-lz/lz brains containing the GAD65-GFP reporter, Rosa-STOP-tdTomato (Ai9) indicator, and indicated Cre driver collected at E15.5. Shown are isolated images of X-gal stains in bright-field, Tom and GFP fluorescence in confocal, and merged signals. Asterisks identify the ganglionic eminences noting the X-gal staining for EB2 expression is present in the inhibitory neuron population in the EB2-lz, EB2-lz + Nex-Cre, and EB2-lz + Emx1-Cre embryos, but visibly absent in the EB2-lz + Dlx1/2-Cre embryo. Also note that the GAD65-GFP signal is appreciably more intense in the WT and EB2-lz + Dlx1/2-Cre sections, as the prominent X-gal staining for EB2 expression in the ganglionic eminences masks the GFP signal in the EB2-lz, EB2-lz + Nex-Cre, and EB2-lz + Emx1-Cre embryos. Arrows identify the neocortex noting the X-gal staining for EB2 expression is present only in the inner/deeper layers in the EB2-lz + Nex-Cre embryo and is completely absent in the neocortex of the EB2-lz + Emx1-Cre embryo.
Fig. 9
Fig. 9. Ephrin-B2 functions as a non-autonomous ligand to direct interneuron migration in the neocortex
Female mice heterozygous for the EB2-lz mutation and homozygous for the Rosa26-STOP-tdTomato (Ai9) Cre indicator were crossed to male mice also heterozygous for the EB2-lz mutation and carrying the GAD65-GFP reporter and one of the following Cre drivers: Dlx1/2-Cre (inhibitory neurons), Nex-Cre (excitatory neurons), and Emx1-Cre (excitatory neurons and radial glial cells) to induce formation of EB2-T mutants in the corresponding cell types. Shown are representative low and high magnification confocal images of GAD65-GFP labeled cells from WT.Cre (upper panels), EB2-lz/lz (middle panels), and EB2-lz/lz.Cre (lower panels) collected at E15.5. Quantification of GAD65-GFP cells is shown at the bottom. No rescue in the migration of GAD65-GFP interneurons into bins 4, 5, and 6 was observed in the EB2-lz/lz mutants that also contain the Dlx1/2-Cre driver (left) or Nex-Cre driver (middle), while striking rescue was observed in the EB2-lz/lz mutants that also contain the Emx-Cre driver. N values for embryonic brain hemispheres: WT.Dlx1/2-Cre (8), EB2-lz/lz.Dlx1/2-Cre (4), WT.Nex-Cre (14), EB2-lz/lz.Nex-Cre (10), WT.Emx-Cre (14), EB2-lz/lz.Emx-Cre (6), EB2-lz/lz (12); mean ± s.e.m.; one-way ANOVA (post-hoc Tukey test); * P< 0.05, ** P< 0.01, *** P<0.001, **** P<0.0001.
Fig. 10
Fig. 10
Summary of results indicating both forward and reverse signaling are involved in the migration of interneurons into the neocortex.

Similar articles

Cited by

References

    1. Andrews W, Barber M, Hernadez-Miranda LR, Xian J, Rakic S, Sundaresan V, Rabbitts TH, Pannell R, Rabbitts P, Thompson H, Erskine L, Murakami F, Parnavelas JG. The role of Slit-Robo signaling in the generation, migration and morphological differentiation of cortical interneurons. Dev Biol. 2008;313:648–658. doi: 10.1016/j.ydbio.2007.10.052. - DOI - PubMed
    1. Attwood BK, Bourgognon JM, Patel S, Mucha M, Schiavon E, Skrzypiec AE, Young KW, Shiosaka S, Korostynski M, Piechota M, Przewlocki R, Pawlak R. Neuropsin cleaves EphB2 in the amygdala to control anxiety. Nature. 2011;473:372–375. doi: 10.1038/nature09938. - DOI - PMC - PubMed
    1. Batista-Brito R, Fishell G. The developmental integration of cortical interneurons into a functional network. Curr Top Dev Biol. 2009;87:81–118. doi: 10.1016/S0070-2153(09)01203-4. - DOI - PMC - PubMed
    1. Bennett KM, Afanador MD, Lal CV, Xu H, Persad E, Legan SK, Chenaux G, Dellinger M, Savani RC, Dravis C, Henkemeyer M, Schwarz MA. Ephrin-B2 reverse signaling increases alpha5beta1 integrin-mediated fibronectin deposition and reduces distal lung compliance. Am J Respir Cell Mol Biol. 2013;49:680–687. doi: 10.1165/rcmb.2013-0002OC. - DOI - PMC - PubMed
    1. Chen L, Toth M. Fragile X mice develop sensory hyperreactivity to auditory stimuli. Neuroscience. 2001;103:1043–1050. S0306452201000367 [pii] - PubMed

Publication types

LinkOut - more resources