. 2017 Oct;29(10):2537-2551.
doi: 10.1105/tpc.17.00256. Epub 2017 Sep 25.

The Photorespiratory Metabolite 2-Phosphoglycolate Regulates Photosynthesis and Starch Accumulation in Arabidopsis

Affiliations

The Photorespiratory Metabolite 2-Phosphoglycolate Regulates Photosynthesis and Starch Accumulation in Arabidopsis

Franziska Flügel et al. Plant Cell. 2017 Oct.

Abstract

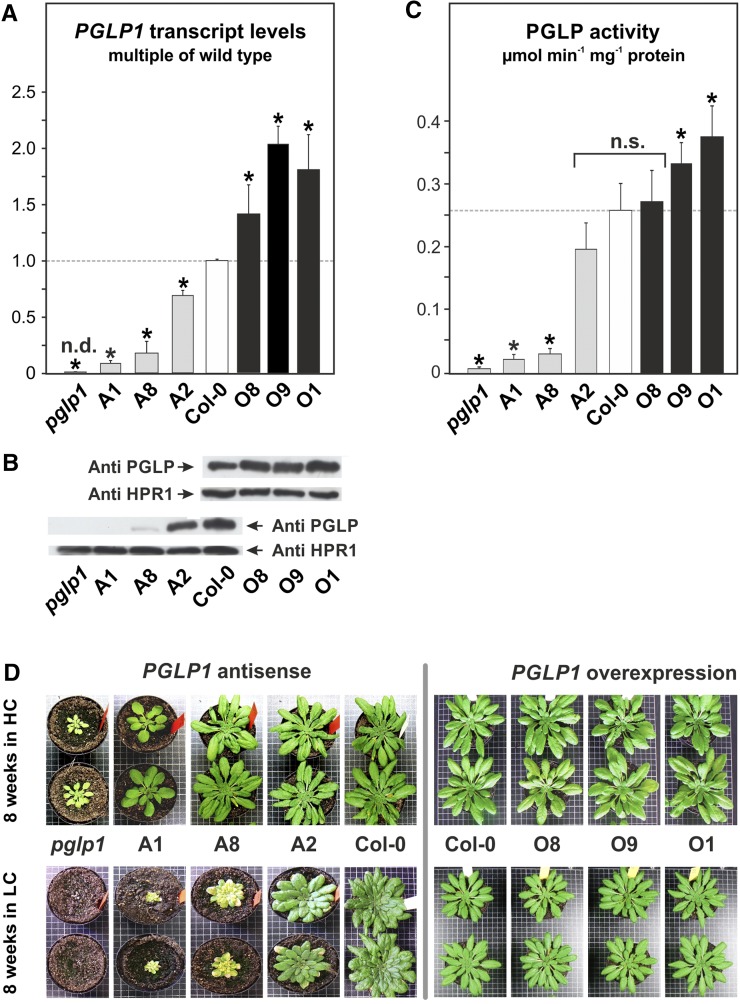
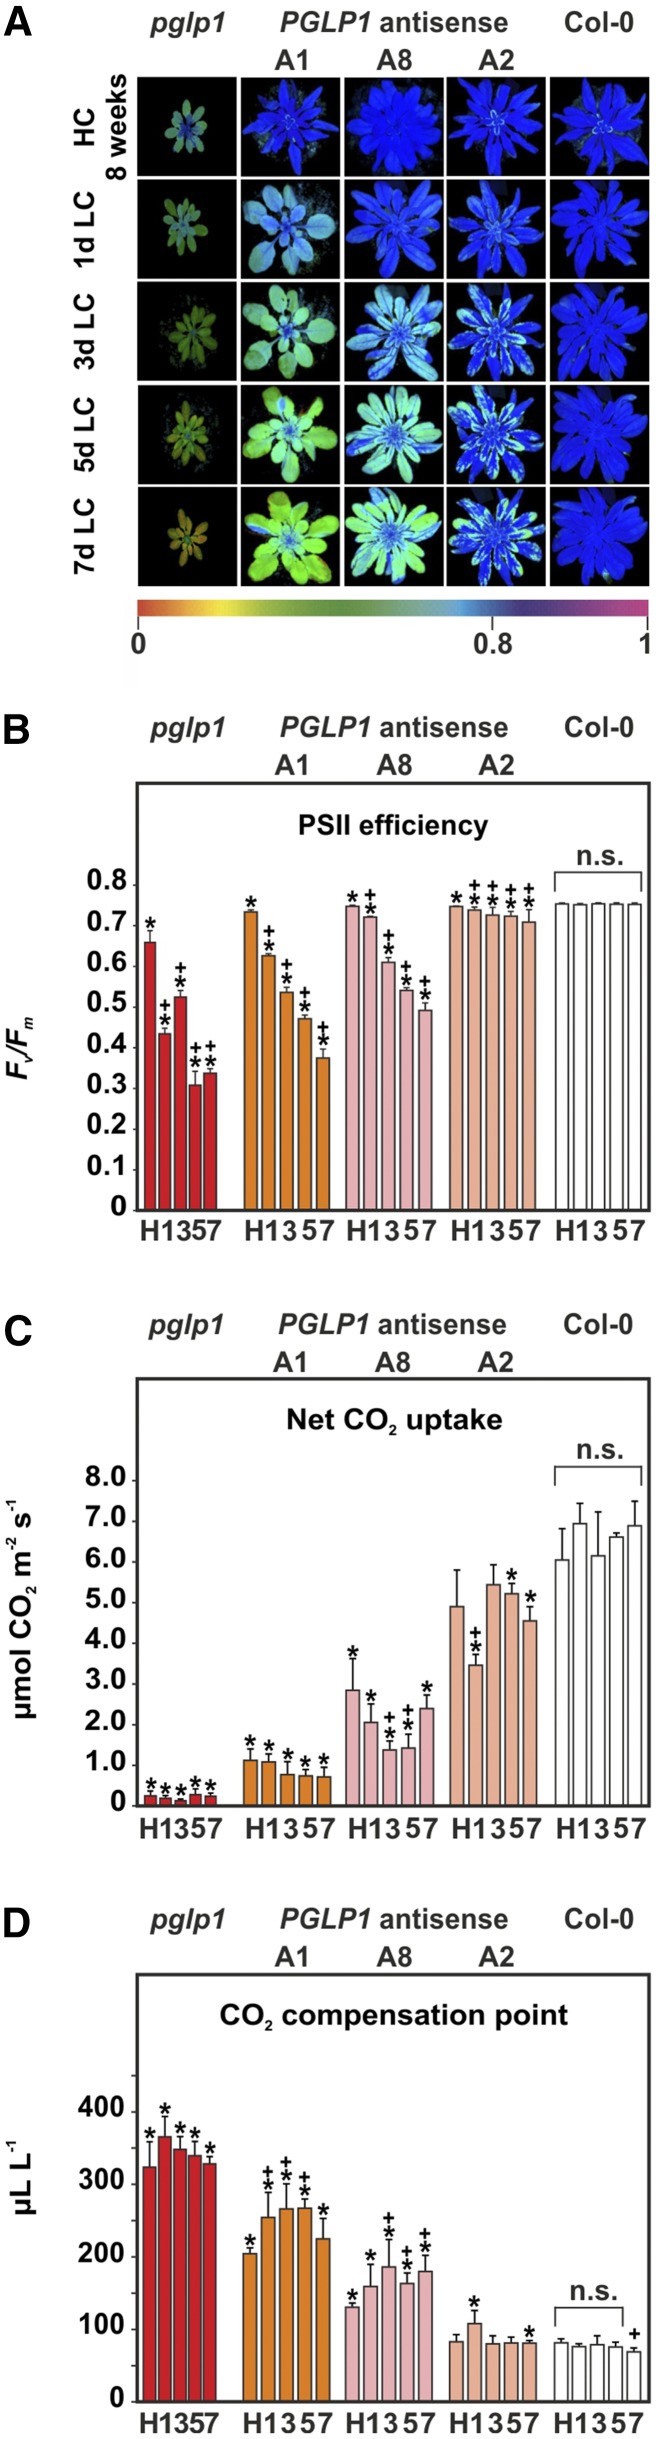
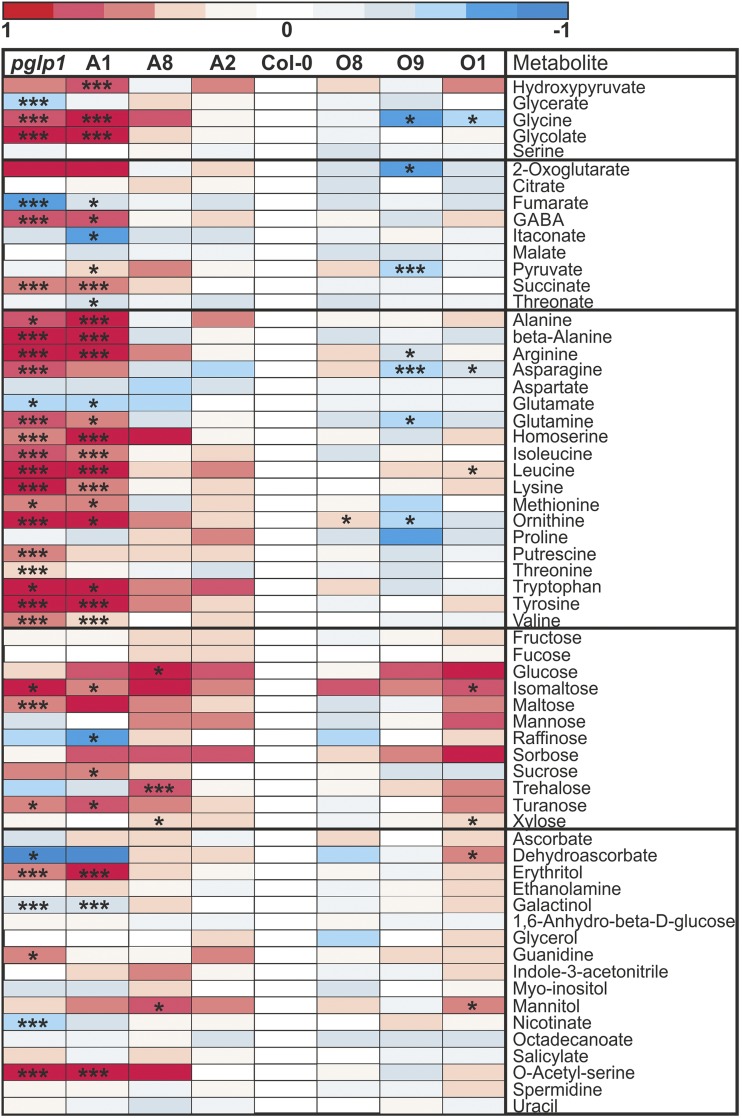
The Calvin-Benson cycle and its photorespiratory repair shunt are in charge of nearly all biological CO2 fixation on Earth. They interact functionally and via shared carbon flow on several levels including common metabolites, transcriptional regulation, and response to environmental changes. 2-Phosphoglycolate (2PG) is one of the shared metabolites and produced in large amounts by oxidative damage of the CO2 acceptor molecule ribulose 1,5-bisphosphate. It was anticipated early on, although never proven, that 2PG could also be a regulatory metabolite that modulates central carbon metabolism by inhibition of triose-phosphate isomerase. Here, we examined this hypothesis using transgenic Arabidopsis thaliana lines with varying activities of the 2PG-degrading enzyme, 2PG phosphatase, and analyzing the impact of this intervention on operation of the Calvin-Benson cycle and other central pathways, leaf carbohydrate metabolism, photosynthetic gas exchange, and growth. Our results demonstrate that 2PG feeds back on the Calvin-Benson cycle. It also alters the allocation of photosynthates between ribulose 1,5-bisphosphate regeneration and starch synthesis. 2PG mechanistically achieves this by inhibiting the Calvin-Benson cycle enzymes triose-phosphate isomerase and sedoheptulose 1,7-bisphosphate phosphatase. We suggest this may represent one of the control loops that sense the ratio of photorespiratory to photosynthetic carbon flux and in turn adjusts stomatal conductance, photosynthetic CO2 and photorespiratory O2 fixation, and starch synthesis in response to changes in the environment.


Figures

Figure 1.
Figure 1.
PGLP1 Expression, Leaf PGLP Enzymatic Activity, and Plant Growth. (A) RT-qPCR quantification of PGLP1 expression in leaves of transgenic lines. The wild-type signal was arbitrarily set to 1. (B) Immunoblot of leaf proteins using a specific antibody against PGLP1 and Hydroxypyruvate Reductase 1 (HPR1) as control. (C) PGLP enzymatic activity in leaves. (D) Antisense and overexpressor plants after growth for 8 weeks, 10-h photoperiod, in air enriched with 1% CO2 (HC) or normal air (LC). Values in (A) and (C) are means ± sd (five different plants per genotype). Asterisks indicate values significantly different from the wild type based on Student’s t test (*P < 0.05; n.d., not detectable; n.s., not significant).
Figure 2.
Figure 2.
Maximum Quantum Efficiency of PSII and Gas Exchange. (A) Chlorophyll a fluorescence images and Fv/Fm color codes. (B) PSII quantum efficiency Fv/Fm. (C) Net photosynthetic CO2 uptake. (D) CO2 compensation points Γ21. Plants were grown for 8 weeks in HC as described in Figure 1D and then transferred to LC. PSII fluorescence and gas exchange parameters were determined at days 0 (H) and 1, 3, 5, and 7 d after transfer to normal air. Data for the pglp1 mutant are included for comparison from a previous study (Timm et al., 2012b). Bars represent means ± sd (five different plants per genotype). Asterisks indicate values significantly different from the HC control and plus signs from the respective wild-type value based on Student’s t test (*P < 0.05).
Figure 3.
Figure 3.
Intermediates of the Calvin-Benson Cycle, Photorespiration, and Sucrose and Starch Synthesis. Leaf samples were harvested at MoD (5 h after first light) from plants grown in HC as described in Figure 1D and the next MoD after 5 h exposure to LC. Concentrations are in nmol g−1 fresh weight. Columns represent means ± sd (four different plants per genotype). Asterisks indicate values significantly different from the wild type based on Student’s t test (*P < 0.05). See Supplemental Data Set 1 for the numerical data.
Figure 4.
Figure 4.
Heat Maps of Relative Metabolite Abundances at Normal Air (LC). Plants were grown and leaf samples for metabolite analysis by GC-MS harvested exactly as described in Figure 3. Differences are color-coded as shown. Steady state metabolite contents are means ± sd relative to the wild-type mean value in LC (five different plants per genotype). Asterisks indicate values significantly different from the wild type in LC based on Student’s t test (*P < 0.05; ***P < 0.01). See Supplemental Data Set 2 for the numerical data.
Figure 5.
Figure 5.
Leaf ADPG, UDPG, Starch, and Sucrose Contents in HC and LC and Starch Turnover. (A) Contents of ADPG and UDPG at MoD. For details see legend to Figure 3. (B) EoD leaf starch and sucrose contents in HC and 1 d after transfer to LC. (C) Starch synthesis and degradation rates in LC. Columns represent means from at least four different plants. Asterisks indicate values significantly different from the wild type based on Student’s t test (*P < 0.05).

References

    1. Ames B.N. (1966). Assay of inorganic phosphate, total phosphate and phosphatases. In Methods in Enzymology: Complex Carbohydrates, E.F. Neufeld and V. Ginsburg, eds (New York: Academic Press), pp. 115–118.
    1. Anderson L.E. (1971). Chloroplast and cytoplasmic enzymes. II. Pea leaf triose phosphate isomerases. Biochim. Biophys. Acta 235: 237–244. - PubMed
    1. Arrivault S., Guenther M., Ivakov A., Feil R., Vosloh D., van Dongen J.T., Sulpice R., Stitt M. (2009). Use of reverse-phase liquid chromatography, linked to tandem mass spectrometry, to profile the Calvin cycle and other metabolic intermediates in Arabidopsis rosettes at different carbon dioxide concentrations. Plant J. 59: 826–839. - PubMed
    1. Arrivault S., Guenther M., Fry S.C., Fuenfgeld M.M.F.F., Veyel D., Mettler-Altmann T., Stitt M., Lunn J.E. (2015). Synthesis and use of stable-isotope-labeled internal standards for quantification of phosphorylated metabolites by LC-MS/MS. Anal. Chem. 87: 6896–6904. - PubMed
    1. Arrivault S., Obata T., Szecówka M., Mengin V., Guenther M., Hoehne M., Fernie A.R., Stitt M. (2017). Metabolite pools and carbon flow during C4 photosynthesis in maize: 13CO2 labeling kinetics and cell type fractionation. J. Exp. Bot. 68: 283–298. - PMC - PubMed

MeSH terms