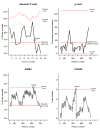
Comparison of control charts for monitoring clinical performance using binary data
- PMID: 28947635
- PMCID: PMC5739852
- DOI: 10.1136/bmjqs-2016-005526
Comparison of control charts for monitoring clinical performance using binary data
Abstract
Background: Time series charts are increasingly used by clinical teams to monitor their performance, but statistical control charts are not widely used, partly due to uncertainty about which chart to use. Although there is a large literature on methods, there are few systematic comparisons of charts for detecting changes in rates of binary clinical performance data.
Methods: We compared four control charts for binary data: the Shewhart p-chart; the exponentially weighted moving average (EWMA) chart; the cumulative sum (CUSUM) chart; and the g-chart. Charts were set up to have the same long-term false signal rate. Chart performance was then judged according to the expected number of patients treated until a change in rate was detected.
Results: For large absolute increases in rates (>10%), the Shewhart p-chart and EWMA both had good performance, although not quite as good as the CUSUM. For small absolute increases (<10%), the CUSUM detected changes more rapidly. The g-chart is designed to efficiently detect decreases in low event rates, but it again had less good performance than the CUSUM.
Implications: The Shewhart p-chart is the simplest chart to implement and interpret, and performs well for detecting large changes, which may be useful for monitoring processes of care. The g-chart is a useful complement for determining the success of initiatives to reduce low-event rates (eg, adverse events). The CUSUM may be particularly useful for faster detection of problems with patient safety leading to increases in adverse event rates. .
Keywords: control charts; quality measurement; run charts; statistical process control.
© Article author(s) (or their employer(s) unless otherwise stated in the text of the article) 2017. All rights reserved. No commercial use is permitted unless otherwise expressly granted.
Conflict of interest statement
Competing interests: None declared.
Figures
References
-
- Sherlaw-Johnson C, Bardsley M. Monitoring change in health care through statistical process control methods. The Nuffield Trust 2016. http://www.nuffieldtrust.org.uk/publications/monitoring-change-health-ca... (accessed 22 Dec 2016).
-
- Woodall WH, Fogel SL, Steiner SH. The monitoring and improvement of surgical-outcome quality. J Qual Technology 2015;47:383–99.
Publication types
MeSH terms
Grants and funding
LinkOut - more resources
Full Text Sources
Other Literature Sources

