

Peroxisome proliferator-activated receptor gamma (PPARγ) regulates lactase expression and activity in the gut
- PMID: 28947679
- PMCID: PMC5666307
- DOI: 10.15252/emmm.201707795
Peroxisome proliferator-activated receptor gamma (PPARγ) regulates lactase expression and activity in the gut
Abstract
Lactase (LCT) deficiency affects approximately 75% of the world's adult population and may lead to lactose malabsorption and intolerance. Currently, the regulation of LCT gene expression remains poorly known. Peroxisome proliferator activator receptorγ (PPARγ) is a key player in carbohydrate metabolism. While the intestine is essential for carbohydrate digestion and absorption, the role of PPARγ in enterocyte metabolic functions has been poorly investigated. This study aims at characterizing PPARγ target genes involved in intestinal metabolic functions. In microarray analysis, the LCT gene was the most upregulated by PPARγ agonists in Caco-2 cells. We confirmed that PPARγ agonists were able to increase the expression and activity of LCT both in vitro and in vivo in the proximal small bowel of rodents. The functional response element activated by PPARγ was identified in the promoter of the human LCT gene. PPARγ modulation was able to improve symptoms induced by lactose-enriched diet in weaned rats. Our results demonstrate that PPARγ regulates LCT expression, and suggest that modulating intestinal PPARγ activity might constitute a new therapeutic strategy for lactose malabsorption.
Keywords: PPARgamma; hypolactasia; intestinal epithelial cells; lactase; lactose intolerance.
© 2017 The Authors. Published under the terms of the CC BY 4.0 license.
Figures
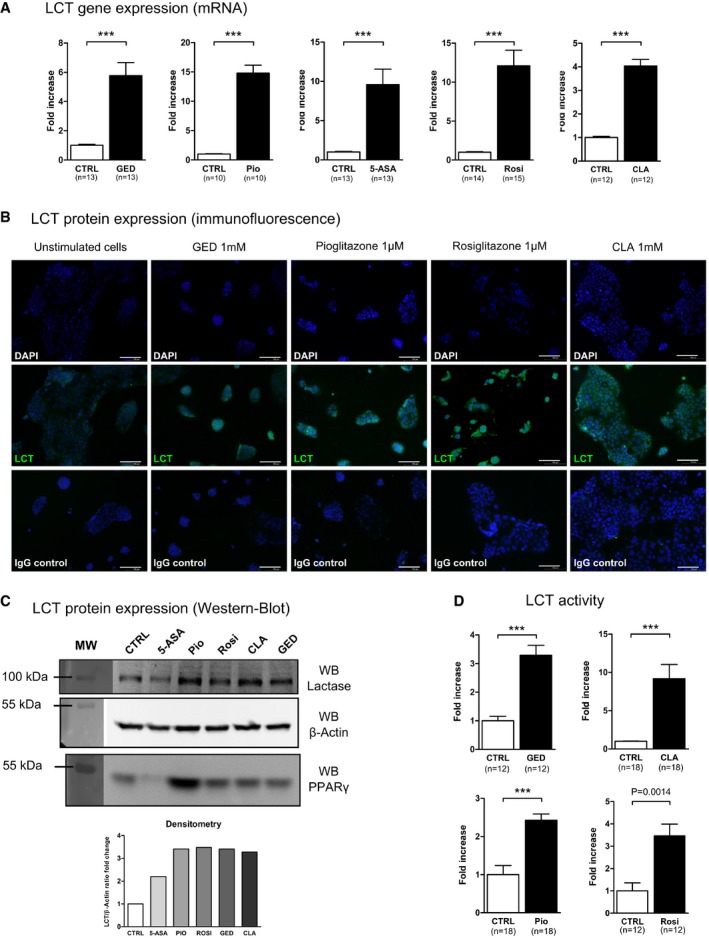
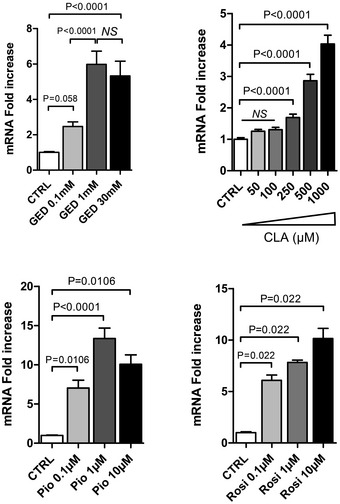
Quantitative PCR (qPCR) analysis of LCT gene expression in stimulated Caco‐2 cells. Cells were stimulated for 24 h with each agonist. Results represent the fold change of LCT gene expression normalized to GAPDH level. The expression level measured in control cells was used as reference and defined as 1.
Immunofluorescence staining of Caco‐2 cells for LCT protein (green). Cells were stimulated for 24 h with each agonist. Nuclei are stained with DAPI (blue). Non‐relevant IgG was used as control (“IgG control”). Scale bar, 100 μm. Magnification ×20.
Western blot analysis of LCT protein expression from stimulated Caco‐2 cells. Densitometric analysis was used to quantify LCT protein.
LCT activity in Caco‐2 cells stimulated for 24 h. Results represent the fold change of LCT activity with respect to the activity measured in control cells arbitrarily defined as 1.
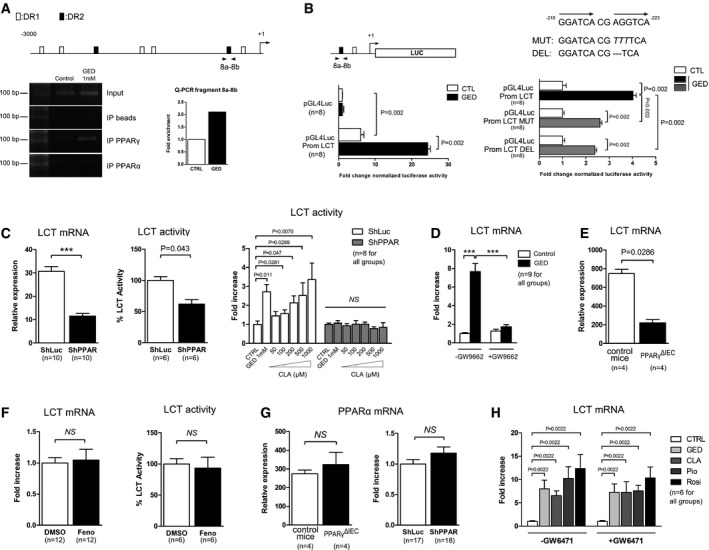
Chromatin immunoprecipitation (ChIP) assay. The top diagram depicts the PPRE predicted by in silico analysis. The picture shows PCR amplification of the 8a–8b fragment in ChIP assay from Caco‐2 cells. Graph bars represent quantification of the 8a–8b fragment by qPCR. Results are expressed as fold enrichment with amplification from control cells defined as 1.
Luciferase gene reporter assay in Caco‐2 cells transfected with pGL4Luc‐PromLCT, pGL4Luc‐PromLCT MUT, and pGL4Luc‐PromLCT DEL reporter constructs. Cells transfected with empty pGL4Luc were used as control. Results represent the fold change luciferase activity normalized for protein content.
LCT gene expression measured by qPCR and LCT activity in PPARγ knockdown Caco‐2 cells (ShPPAR) compared to control cells (ShLuc). LCT activity in ShPPAR cells compared to ShLuc cells stimulated by GED and CLA. The activity levels measured in control cells were arbitrarily defined as one.
Effect of GW9662 on GED‐dependent induction of LCT gene expression in Caco‐2 cells. LCT gene expression was determined by qPCR. Results represent the fold change of LCT gene expression. The expression level measured in control cells (w/o GED and GW9662) was used as reference and defined as 1.
LCT mRNA expression in the proximal small intestine of PPARγΔIEC mice. Results represent the mean ± SD.
LCT mRNA expression and activity in Caco‐2 cells stimulated with fenofibrate compared to control cells (DMSO).
PPARα mRNA expression in the small intestine of PPARγΔIEC mice (left) and in Caco‐2 ShPPARγ/ShLuc cells (right). For mice results, data represent the mean ± SD.
Effect of GW6471 on GED‐, CLA‐, Pio‐, and Rosi‐dependent induction of LCT gene expression in Caco‐2 cells. Results represent the fold change of LCT gene expression. The expression level measured in control cells was used as reference and defined as 1.
- A
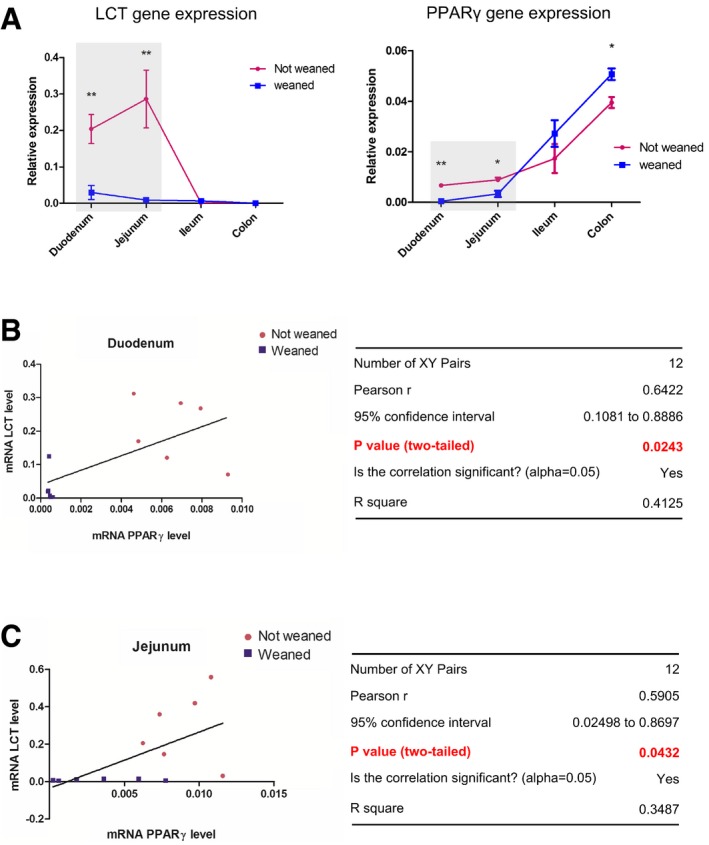
Comparison of the LCT and PPARγ mRNA levels along the gut of “not weaned” and “weaned” rats. Gene expression level was determined by qPCR of corresponding mRNA. Results represent the mean ± SD of the relative expression normalized to GAPDH level (for each group n = 6). *P < 0.05, **P < 0.01. Statistical analysis: two‐tailed nonparametric Mann–Whitney U‐test.
- B, C
Correlation between the LCT mRNA and PPARγ mRNA levels in the duodenum and jejunum of rats (not weaned and weaned).
- A, B
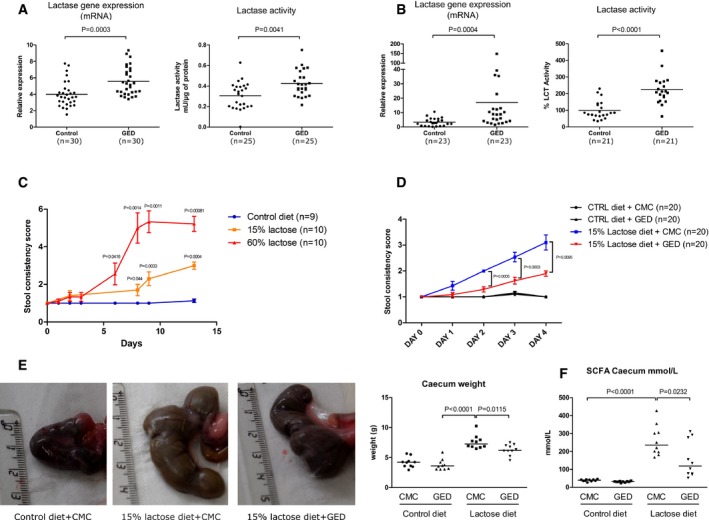
LCT gene expression (qPCR) and LCT activity were assessed in the proximal small intestine of weaned C57BL/6 mice (A) and Sprague Dawley rats (B) treated with oral GED (30 mg/kg) for 7 days. Results represent the sum of three independent experiments. Horizontal bars represent mean values. LCT activities in rats are expressed as the percentage of activity compared to that measured in control animals (arbitrarily defined as 100%).
- C
Stool consistency scores over time in weaned rats fed with lactose‐enriched diets. P‐values between lactose groups and control diet are indicated.
- D
Stool consistency score in rats with and without lactose‐enriched diet treated or not with GED. Results represent the sum of two independent experiments (n = 20 for each group).
- E
Cecum dilatation induced by lactose diet was improved by GED treatment. Photographs show representative pictures of cecum size and morphology in the various groups. Results of cecum weight for one experiment (n = 10 for each group) are represented in the dot plot graph. Horizontal bars represent mean values.
- F
Total SCFA concentration (mmol/l) in the cecal contents (n = 10 for each group). Horizontal bars represent mean values.
Similar articles
-
Essential fatty acid deficiency in mice impairs lactose digestion.Am J Physiol Gastrointest Liver Physiol. 2008 Sep;295(3):G605-13. doi: 10.1152/ajpgi.90206.2008. Epub 2008 Jul 24. Am J Physiol Gastrointest Liver Physiol. 2008. PMID: 18653724
-
Effect of C/T -13910 cis-acting regulatory variant on expression and activity of lactase in Indian children and its implication for early genetic screening of adult-type hypolactasia.Clin Chim Acta. 2011 Oct 9;412(21-22):1924-30. doi: 10.1016/j.cca.2011.06.032. Epub 2011 Jul 6. Clin Chim Acta. 2011. PMID: 21763294
-
From 'lactose intolerance' to 'lactose nutrition'.Asia Pac J Clin Nutr. 2015;24 Suppl 1:S1-8. doi: 10.6133/apjcn.2015.24.s1.01. Asia Pac J Clin Nutr. 2015. PMID: 26715078 Review.
-
Genetic variation and lactose intolerance: detection methods and clinical implications.Am J Pharmacogenomics. 2004;4(4):239-45. doi: 10.2165/00129785-200404040-00003. Am J Pharmacogenomics. 2004. PMID: 15287817 Review.
-
Lactose and lactase--who is lactose intolerant and why?J Pediatr Gastroenterol Nutr. 2007 Dec;45 Suppl 2:S131-7. doi: 10.1097/MPG.0b013e31812e68f6. J Pediatr Gastroenterol Nutr. 2007. PMID: 18185074 Review.
Cited by
-
Impact of elastin-derived VGVAPG peptide on bidirectional interaction between peroxisome proliferator-activated receptor gamma (Pparγ) and beta-galactosidase (β-Gal) expression in mouse cortical astrocytes in vitro.Naunyn Schmiedebergs Arch Pharmacol. 2019 Apr;392(4):405-413. doi: 10.1007/s00210-018-1591-4. Epub 2018 Dec 3. Naunyn Schmiedebergs Arch Pharmacol. 2019. PMID: 30511276
-
A Synbiotic Combining Chitin-Glucan and Lactobacillus acidophilus NCFM Induces a Colonic Molecular Signature Soothing Intestinal Pain and Inflammation in an Animal Model of IBS.Int J Mol Sci. 2024 Oct 5;25(19):10732. doi: 10.3390/ijms251910732. Int J Mol Sci. 2024. PMID: 39409061 Free PMC article.
-
Whole blood transcriptional responses of very preterm infants during late-onset sepsis.PLoS One. 2020 Jun 1;15(6):e0233841. doi: 10.1371/journal.pone.0233841. eCollection 2020. PLoS One. 2020. PMID: 32479514 Free PMC article.
-
A novel plausible mechanism of NSAIDs-induced apoptosis in cancer cells: the implication of proline oxidase and peroxisome proliferator-activated receptor.Pharmacol Rep. 2020 Oct;72(5):1152-1160. doi: 10.1007/s43440-020-00140-z. Epub 2020 Jul 24. Pharmacol Rep. 2020. PMID: 32710395 Free PMC article. Review.
-
The Role of PGC-1α in Aging Skin Barrier Function.Cells. 2024 Jul 2;13(13):1135. doi: 10.3390/cells13131135. Cells. 2024. PMID: 38994987 Free PMC article. Review.
References
-
- Alexandre V, Even PC, Larue‐Achagiotis C, Blouin JM, Blachier F, Benamouzig R, Tome D, Davila AM (2013) Lactose malabsorption and colonic fermentations alter host metabolism in rats. Br J Nutr 110: 625–631 - PubMed
-
- Bertin B, Dubuquoy L, Colombel JF, Desreumaux P (2013) PPAR‐gamma in ulcerative colitis: a novel target for intervention. Curr Drug Targets 14: 1501–1507 - PubMed
-
- Bouguen G, Langlois A, Djouina M, Branche J, Koriche D, Dewaeles E, Mongy A, Auwerx J, Colombel JF, Desreumaux P et al (2015) Intestinal steroidogenesis controls PPARgamma expression in the colon and is impaired during ulcerative colitis. Gut 64: 901–910 - PubMed
-
- Curry A (2013) Archaeology: the milk revolution. Nature 500: 20–22 - PubMed
Publication types
MeSH terms
Substances
LinkOut - more resources
Full Text Sources
Other Literature Sources
Molecular Biology Databases
Research Materials
