

Gender Differences in the Acute Kidney Injury to Chronic Kidney Disease Transition
- PMID: 28947737
- PMCID: PMC5612964
- DOI: 10.1038/s41598-017-09630-2
Gender Differences in the Acute Kidney Injury to Chronic Kidney Disease Transition
Abstract
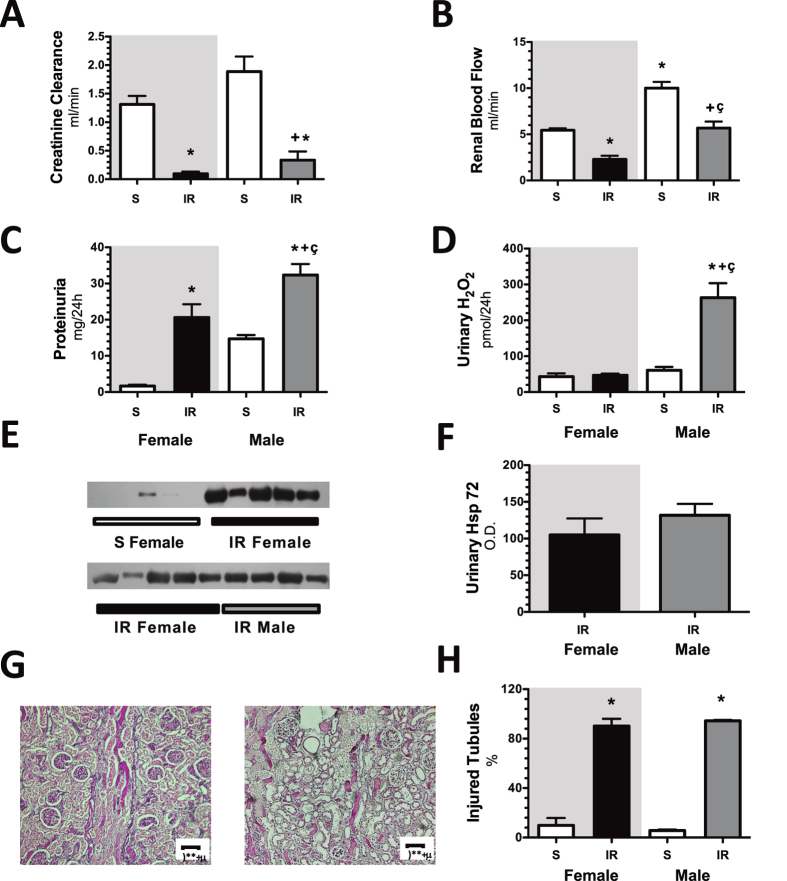
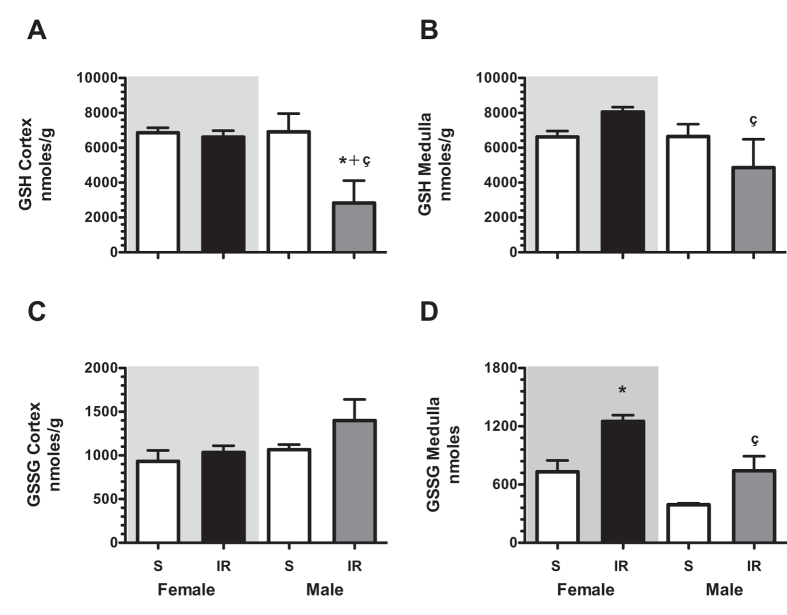
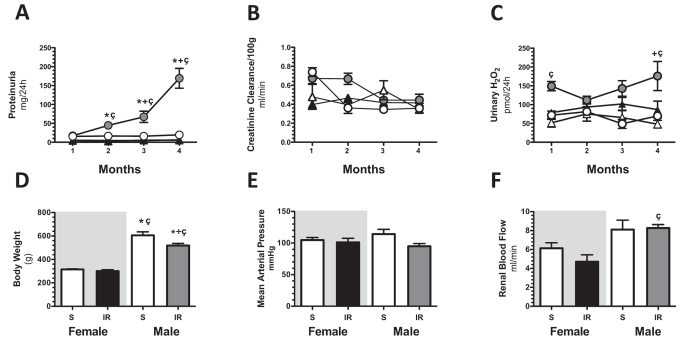
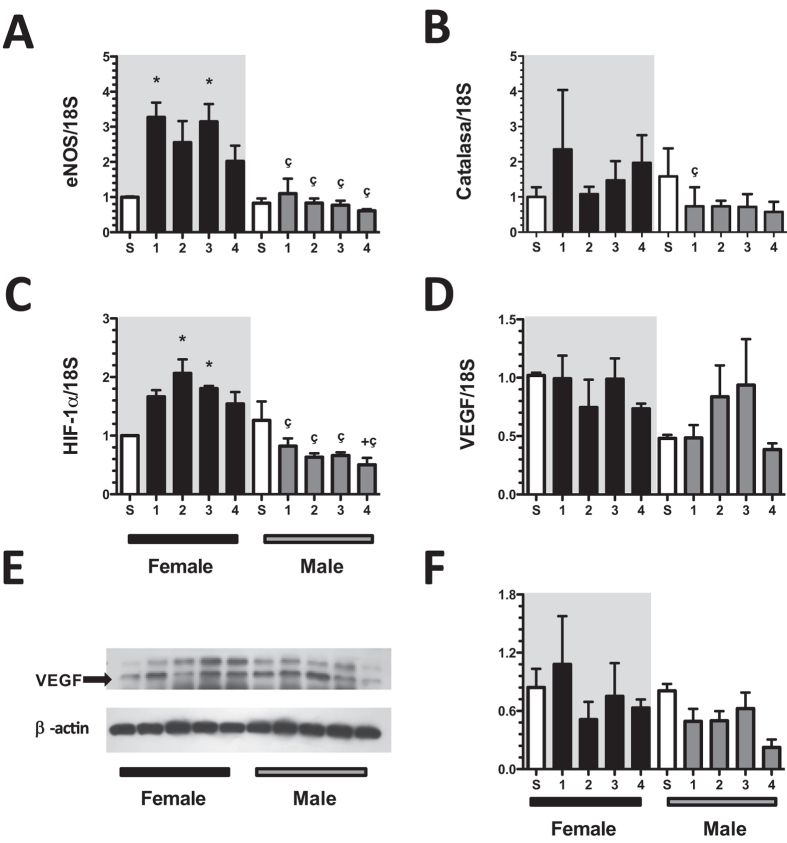
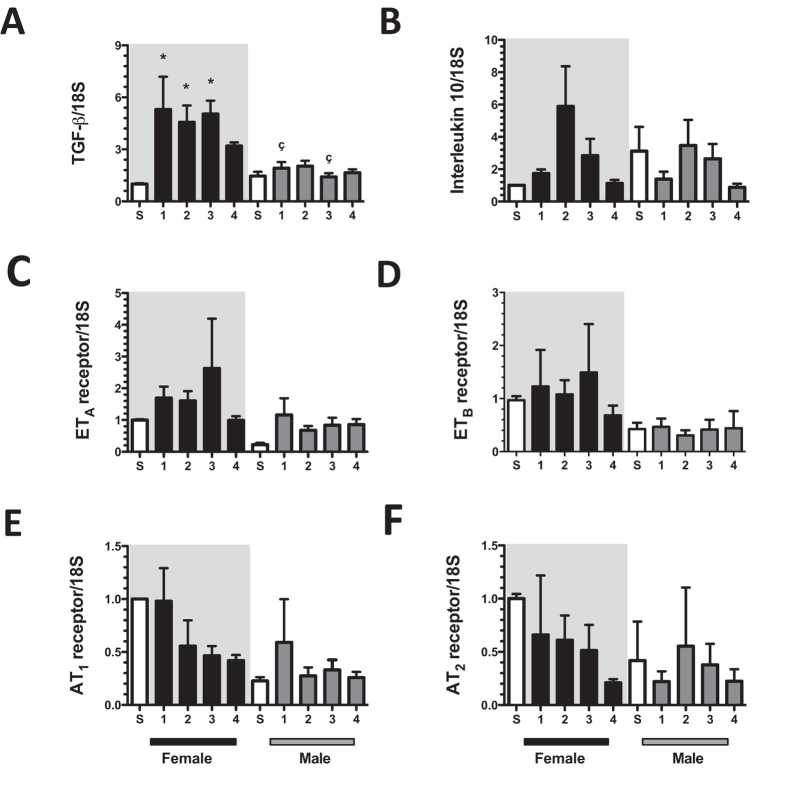
This study evaluated if there is a sexual dimorphism in the acute kidney injury (AKI) to chronic kidney disease (CKD) transition and the time-course of the potential mechanisms involved in the dimorphic response. Female and male rats were divided into sham-operated or underwent 45-min renal ischemia (F + IR, and M + IR). All groups were studied at 24-h and 1, 2, 3, or 4-months post-ischemia. Additionally, oophorectomized rats were divided into sham or IR groups. After 24-h, AKI extent was simllar in females and males, but female rats exhibited less oxidative stress and increased renal GSH content. After 4-months and despite similar AKI, the M + IR group developed CKD characterized by proteinuria, tubulointerstitial fibrosis, glomerular hypertrophy, increased oxidative stress and a reduction in HIF1α and VEGF from the 1st-month and persisting throughout the time-course studied. Interestingly, the F + IR group did not develop CKD due to lesser oxidative stress and increased eNOS, TGFβ and HIF1α mRNA levels from the 1st-month after IR. Whereas, oophorectomized rats did develop CKD. We found a sexual dimorphic response in the AKI to CKD transition. Early antioxidant defense and higher TGFβ, HIF1α and eNOS were among the renoprotective mechanisms that the F + IR group demonstrated.
Conflict of interest statement
The authors declare that they have no competing interests.
Figures


Similar articles
-
Vegfa promoter gene hypermethylation at HIF1α binding site is an early contributor to CKD progression after renal ischemia.Sci Rep. 2021 Apr 22;11(1):8769. doi: 10.1038/s41598-021-88000-5. Sci Rep. 2021. PMID: 33888767 Free PMC article.
-
Delayed spironolactone administration prevents the transition from acute kidney injury to chronic kidney disease through improving renal inflammation.Nephrol Dial Transplant. 2019 May 1;34(5):794-801. doi: 10.1093/ndt/gfy246. Nephrol Dial Transplant. 2019. PMID: 30107561
-
AT1 receptor antagonism before ischemia prevents the transition of acute kidney injury to chronic kidney disease.Kidney Int. 2016 Feb;89(2):363-73. doi: 10.1038/ki.2015.320. Kidney Int. 2016. PMID: 26509589
-
AKI on CKD: heightened injury, suppressed repair, and the underlying mechanisms.Kidney Int. 2017 Nov;92(5):1071-1083. doi: 10.1016/j.kint.2017.06.030. Epub 2017 Sep 8. Kidney Int. 2017. PMID: 28890325 Free PMC article. Review.
-
Hypoxia as a key player in the AKI-to-CKD transition.Am J Physiol Renal Physiol. 2014 Dec 1;307(11):F1187-95. doi: 10.1152/ajprenal.00425.2014. Epub 2014 Oct 1. Am J Physiol Renal Physiol. 2014. PMID: 25350978 Review.
Cited by
-
Prevention of Transition from Acute Kidney Injury to Chronic Kidney Disease Using Clinical-Grade Perinatal Stem Cells in Non-Clinical Study.Int J Mol Sci. 2024 Sep 6;25(17):9647. doi: 10.3390/ijms25179647. Int J Mol Sci. 2024. PMID: 39273595 Free PMC article.
-
The association between intraoperative urine output and postoperative acute kidney injury differs between partial and radical nephrectomy.Sci Rep. 2019 Jan 24;9(1):760. doi: 10.1038/s41598-018-37432-7. Sci Rep. 2019. PMID: 30679704 Free PMC article.
-
Comorbidity, life-style factors and healthcare utilization in incident chronic kidney disease: sex-specific analyses of claims data.Nephrol Dial Transplant. 2023 Feb 28;38(3):722-732. doi: 10.1093/ndt/gfac245. Nephrol Dial Transplant. 2023. PMID: 35998324 Free PMC article.
-
Sex Bias in Prediction and Diagnosis of Cardiac Surgery Associated Acute Kidney Injury.Res Sq [Preprint]. 2024 Mar 14:rs.3.rs-3660617. doi: 10.21203/rs.3.rs-3660617/v1. Res Sq. 2024. Update in: BMC Nephrol. 2024 May 22;25(1):180. doi: 10.1186/s12882-024-03614-x. PMID: 38558997 Free PMC article. Updated. Preprint.
-
Epidemiology and outcomes of post-AKI proteinuria.Clin Kidney J. 2023 May 26;16(11):2262-2270. doi: 10.1093/ckj/sfad129. eCollection 2023 Nov. Clin Kidney J. 2023. PMID: 37915920 Free PMC article.
References
Publication types
MeSH terms
Substances
LinkOut - more resources
Full Text Sources
Other Literature Sources
Medical
