. 2017 Sep 25;8(1):691.
doi: 10.1038/s41467-017-00702-5.

ZNF516 suppresses EGFR by targeting the CtBP/LSD1/CoREST complex to chromatin

Affiliations

ZNF516 suppresses EGFR by targeting the CtBP/LSD1/CoREST complex to chromatin

Lifang Li et al. Nat Commun. .

Abstract

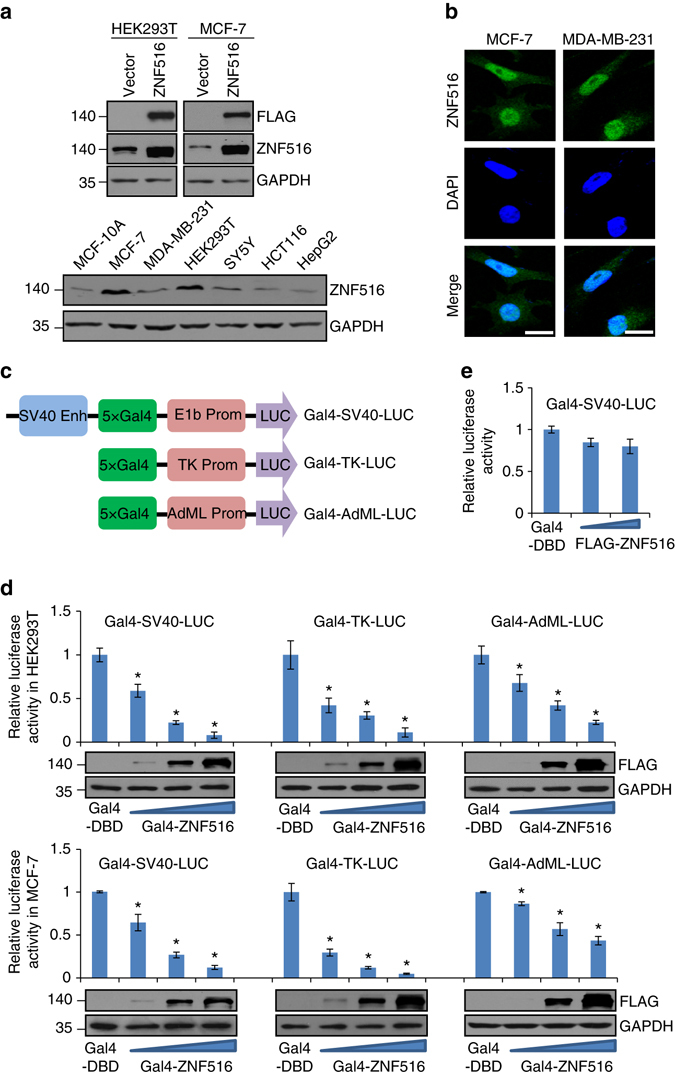
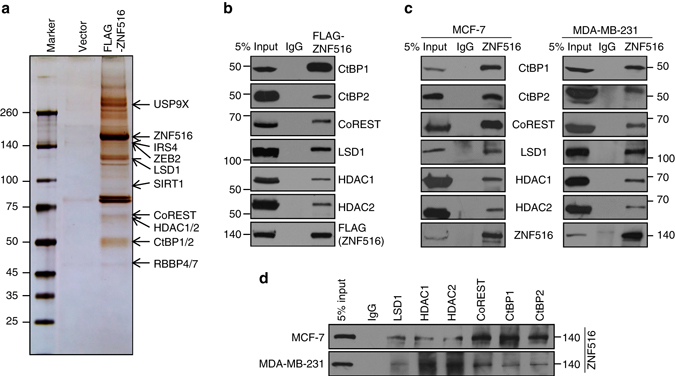
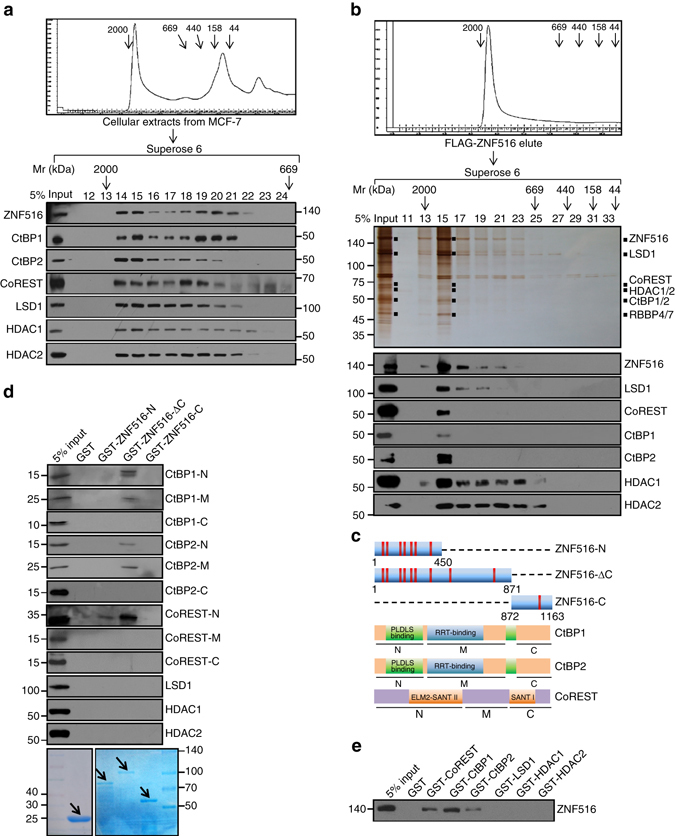
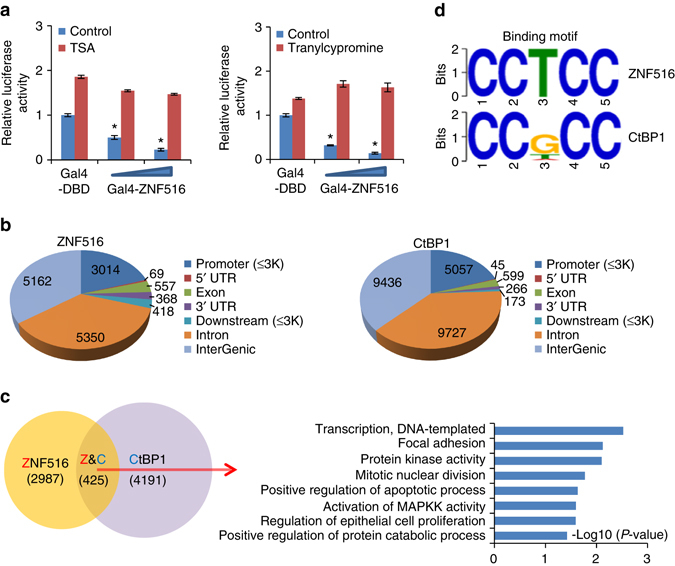
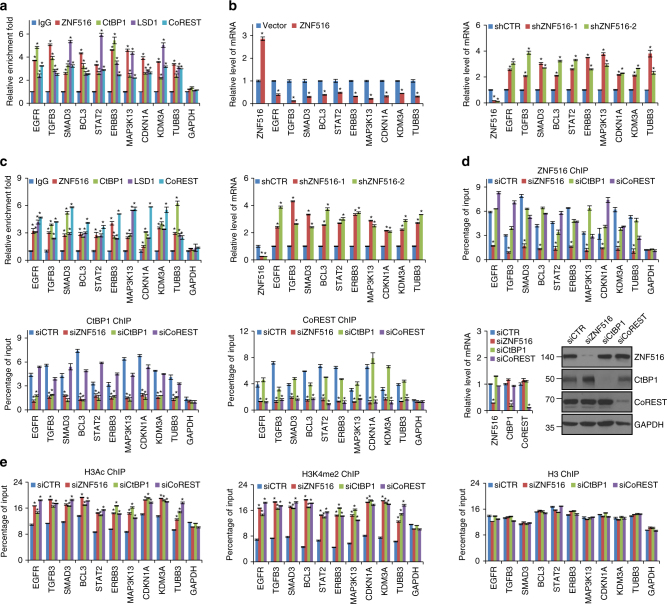
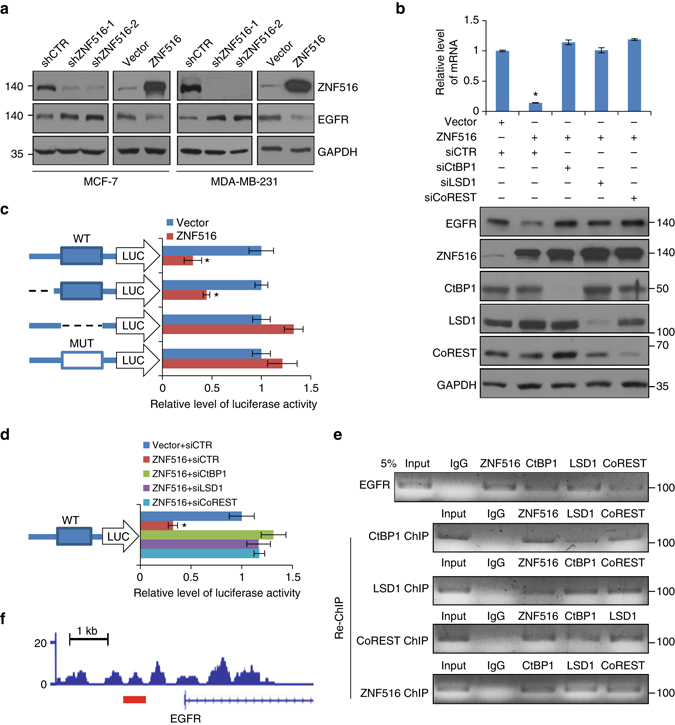
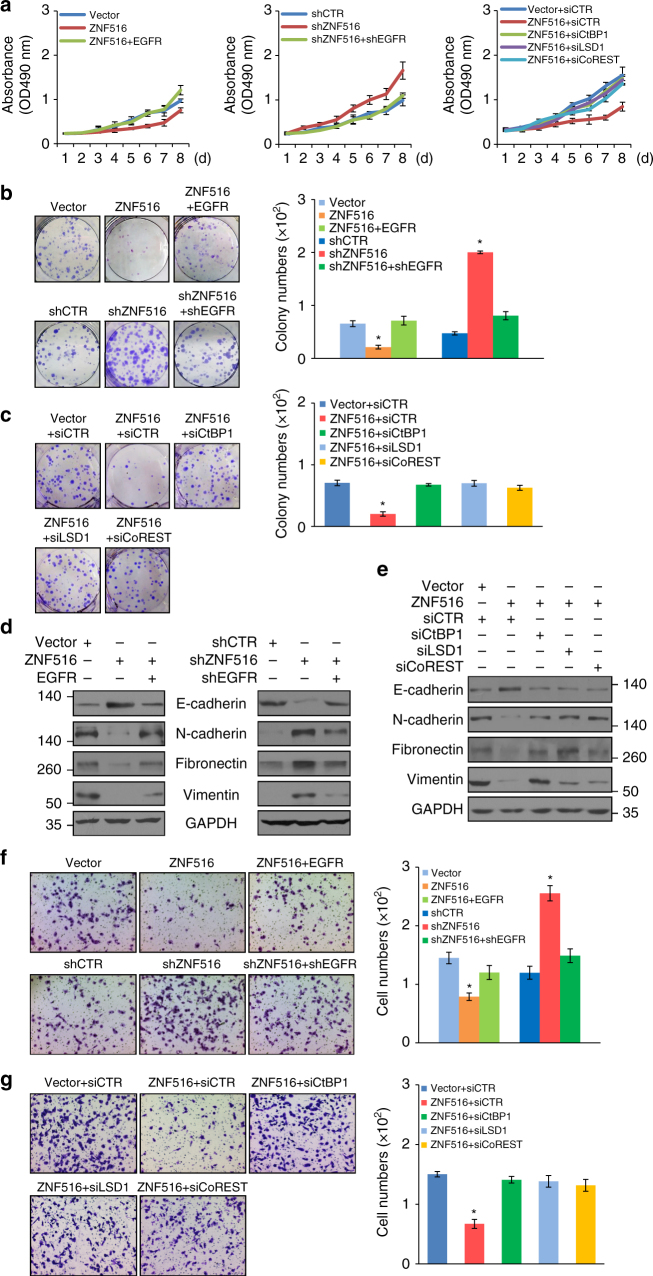
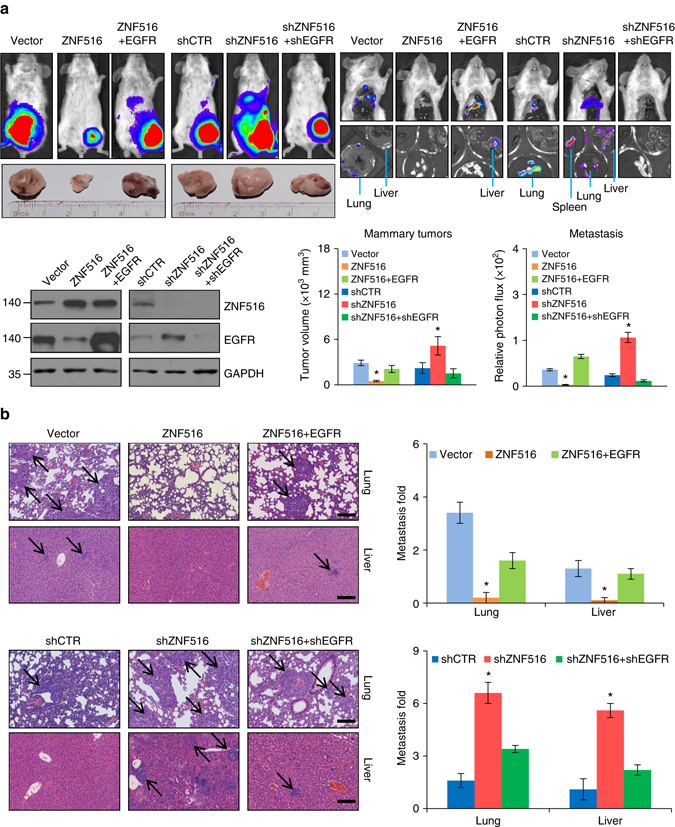
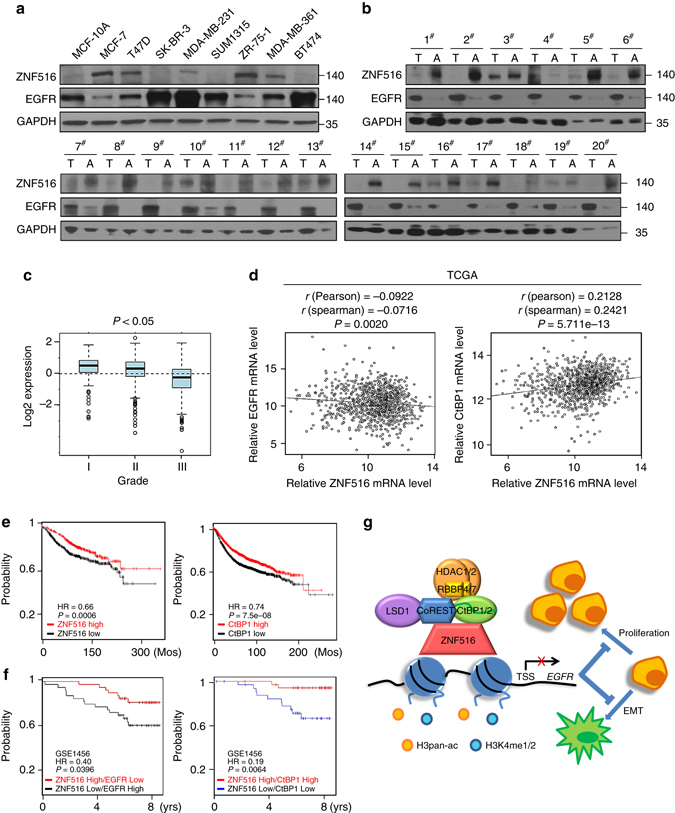
EGFR is required for animal development, and dysregulation of EGFR is critically implicated in malignant transformation. However, the molecular mechanism underlying the regulation of EGFR expression remains poorly explored. Here we report that the zinc-finger protein ZNF516 is a transcription repressor. ZNF516 is physically associated with the CtBP/LSD1/CoREST complex and transcriptionally represses a cohort of genes including EGFR that are critically involved in cell proliferation and motility. We demonstrate that the ZNF516-CtBP/LSD1/CoREST complex inhibits the proliferation and invasion of breast cancer cells in vitro and suppresses breast cancer growth and metastasis in vivo. Significantly, low expression of ZNF516 is positively associated with advanced pathological staging and poor survival of breast carcinomas. Our data indicate that ZNF516 is a transcription repressor and a potential suppressor of EGFR, adding to the understanding of EGFR-related breast carcinogenesis and supporting the pursuit of ZNF516 as a potential therapeutic target for breast cancer. EGFR is a well-known oncogene; however, the mechanisms regulating its expression are still unclear. Here, analysing genome-wide chromatin associations, the authors show that in breast cancer cells ZNF516 represses EGFR transcription through the interaction with the CtBP/LSD1/CoREST complex.


Conflict of interest statement

The authors declare no competing financial interests.

Figures

Fig. 1
Fig. 1
ZNF516 is a transcription repressor. a Western blotting analysis of ZNF516 protein expression. HEK293T or MCF-7 cells were transfected with empty vector or FLAG-ZNF516. Cellular proteins were extracted from indicated cell lines and western blotting was performed with a monoclonal antibody against FLAG, GAPDH, or polyclonal antibodies against ZNF516. b Subcellular localization of ZNF516 protein. The distribution of endogenous ZNF516 was detected by immunofluorescent microscopy with polyclonal antibodies against ZNF516. DAPI staining was included to visualize the cell nucleus. Scale bar 20 μm. c The schematic diagram showing the Gal4-luciferase reporters. d Transcription repression by ZNF516. HEK293T or MCF-7 cells were transfected with different amounts of Gal4-ZNF516 expression plasmids, together with the indicated Gal4-luciferase reporter. Forty-eight hours later, luciferase activity was measured. Relative luciferase activity was calculated as firefly luciferase activity divided by renilla luciferase activity and shown relative to the control (transfected with Gal4-DBD vector). The expression of Gal4-ZNF516 was shown by western blotting. e MCF-7 cells were transfected with different amounts of FLAG-ZNF516 plasmids, together with the Gal4-SV40-LUC luciferase reporter. Forty-eight hours later, luciferase activity was measured. Relative luciferase activity was calculated as firefly luciferase activity divided by renilla luciferase activity and shown relative to the control. Each bar represents the mean ± S.D. for triplicate experiments. P-values were determined by Student’s t-test. *P < 0.05
Fig. 2
Fig. 2
Identification of ZNF516-associated proteins. a Mass spectrometry analysis of ZNF516-associated proteins. Cellular extracts from HEK293T cells stably expressing FLAG-ZNF516 were immunopurified with anti-FLAG affinity column and eluted with FLAG peptides. The eluates were resolved by SDS-PAGE and silver-stained. The protein bands were retrieved and analyzed by mass spectrometry. b Interaction of ZNF516 with the components of the CtBP/LSD1/CoREST complex. Whole-cell lysates from HEK293T cells transfected with FLAG-ZNF516 were prepared and immunoprecipitation was performed with anti-FLAG followed by immunoblotting with antibodies against indicated proteins. c Whole-cell lysates from MCF-7 or MDA-MB-231 cells were immunoprecipitated with antibodies against ZNF516 or IgG followed by immunoblotting with the antibodies against the indicated proteins. d Whole-cell lysates from MCF-7 or MDA-MB-231 cells were immunoprecipitated with antibodies against indicated proteins or IgG followed by immunoblotting with the antibodies against ZNF516
Fig. 3
Fig. 3
ZNF516 interacts with CtBP/LSD1/CoREST complex in vivo and in vitro. a Co-fractionation of ZNF516 and CtBP/LSD1/CoREST complex by FPLC. MCF-7 cell proteins were extracted, concentrated, and then fractionated on Superose 6 size exclusion columns. Chromatographic elution profiles and immunoblotting analysis of the chromatographic fractions are shown. The elution positions of calibration proteins with known molecular masses are indicated, and an equal volume from each fraction was analyzed. b Silver staining and western blot analysis of the ZNF516-containing complex fractionated by Superose 6 gel filtration. Cellular extracts from HEK293T cells transfected with FLAG-ZNF516 were fractionated on Superose 6 size exclusion columns. Chromatographic elution profiles, silver staining, and western blot analysis of the chromatographic fractions are shown. The elution positions of calibration proteins with known molecular masses are indicated, and an equal volume from each fraction was analyzed. c Schematic diagrams of ZNF516, CtBP1/2, and CoREST deletion mutants. d GST pull-down experiments were performed with bacterially expressed GST or GST-fused ZNF516 deletion mutants and in vitro transcribed/translated truncation mutants of CtBP1, CtBP2, or CoREST, or full length of LSD1, HDAC1 or HDAC2. Coomassie brilliant blue staining of the GST-fused proteins was shown with arrows. e Bacterially expressed GST or GST-fused indicated proteins were performed GST pull-down experiments with in vitro transcribed/translated ZNF516
Fig. 4
Fig. 4
Identification of transcriptional targets for ZNF516. a MCF-7 cells were transfected with Gal4-DBD or Gal4-ZNF516 plasmids and were treated with trichostatin A (TSA) or tranylcypromine. Forty-eight hours later, luciferase activity of Gal4-SV40-LUC was measured. Relative luciferase activity was calculated as firefly luciferase activity divided by renilla luciferase activity and shown relative to the control. Each bar represents the mean ± S.D. for triplicate experiments. P-values were determined by Student’s t-test. *P < 0.05. b Genomic distribution of ZNF516 and CtBP1 (published in ref. ) determined by ChIP-seq analysis in MCF-7 cells. Number of peaks in each cluster was indicated. c The Venn diagram of overlapping genes targeted by ZNF516 and CtBP1 in MCF-7 cells (left). The clustering of the 425 overlapping target genes of ZNF516/CtBP1 into biological process ontologies is shown (right). The details of the ChIP-seq experiments were provided in the Materials and Methods and results on the ontologies were provided in Supplementary Data 2. d The analysis of ZNF516-bound motifs and CtBP1-bound motifs using MEME suite. Top 10 motifs enriched at ZNF516 peaks were listed in Supplementary Fig. 2
Fig. 5
Fig. 5
Verification of the ChIP-seq results in breast cancer cells. a Verification of the ChIP-seq results by qChIP analysis of the indicated genes. MCF-7 cells were collected and qChIP experiments were performed with indicated antibodies. Results are represented as fold change over control IgG with GAPDH as a negative control. b Total cellular RNAs were prepared from MCF-7 cells with ZNF516 overexpression or knockdown for quantitative real-time RT-PCR analysis of the indicated genes. c Verification of the ChIP-seq results by qChIP analysis (left) and quantitative real-time RT-PCR analysis (right) of the indicated genes in MDA-MB-231 cells. d MCF-7 cells were transfected with the control, ZNF516, CtBP1, or CoREST siRNAs. qChIP analysis of the selected promoters was performed using antibodies against indicated proteins. Results are represented as fold change over control IgG with GAPDH as a negative control. The knockdown efficiencies of ZNF516, CtBP1, and CoREST were verified by real-time RT-PCR and western blotting. e MCF-7 cells were transfected with the control, ZNF516, CtBP1, or CoREST siRNAs. qChIP analysis of the selected promoters was performed using antibodies against H3Ac, or H3K4me2. H3 was detected as an internal control. Each bar represents the mean ± S.D. for triplicate experiments. P-values were determined by Student’s t-test. *P < 0.05
Fig. 6
Fig. 6
Transcription repression of EGFR by ZNF516-CtBP/LSD1/CoREST complex. a Total cellular proteins were prepared from MCF-7 and MDA-MB-231 cells with ZNF516 overexpression or knockdown and analyzed for EGFR protein expression by western blotting. b MCF-7 cells were transfected with siRNAs of control, CtBP1, CoREST, or LSD1 together with empty vector or ZNF516 expression constructs. The mRNA or protein level of EGFR was measured by real-time RT-PCR or western blotting. c MCF-7 cells were co-transfected with EGFR-Luc wild-type, deletion, or mutants and expression construct for ZNF516. Forty-eight hours after the transfection, luciferase activity was measured. Relative luciferase activity was calculated as firefly luciferase activity divided by renilla luciferase activity and shown relative to the control. d MCF-7 cells were transfected control, CtBP1, LSD1 or CoREST siRNAs together with EGFR-Luc construct and ZNF516 expression constructs. Forty-eight hours after the transfection, luciferase activity was measured. Relative luciferase activity was calculated as firefly luciferase activity divided by renilla luciferase activity and shown relative to the control. e Co-occupancy of the EGFR promoter by ZNF516 and the components of CtBP/LSD1/CoREST complex. Soluble chromatin from MCF-7 cells was prepared for ChIP and Re-ChIP assays with antibodies against the indicated proteins. f The ChIP-seq track at EGFR promoter. The red line indicates the binding site of ZNF516 on the EGFR promoter. Each bar represents the mean ± S.D. for triplicate experiments. P-values were determined by Student’s t-test. *P < 0.05
Fig. 7
Fig. 7
ZNF516 inhibits the proliferation and invasion of breast cancer cells in vitro. a MCF-7 cells were infected with lentiviruses carrying FLAG-tagged ZNF516 or/and EGFR (left), or with lentiviruses carrying ZNF516 shRNA or/and EGFR shRNA (middle), or MCF-7 cells were transfected with the control, CtBP1, CoREST, or LSD1 siRNAs together with expression constructs for ZNF516 (right). Cells were split into 96-well plates and then harvested at indicated day. The growth curves of the cells were measured with MTS assay. Each point represents the mean ± S.D. for three independent experiments. b MCF-7 cell stably transfected with indicated plasmids were maintained for 14 days before staining with crystal violet and counting for colony numbers in colony formation assay. c MCF-7 cells transfected with indicated siRNAs and expression plasmids were tested for colony formation assay. d MCF-7 cells were infected with lentiviruses carrying indicated plasmids, and the expressions of epithelial and mesenchymal protein markers were tested by western blotting. e The expressions of the epithelial and mesenchymal markers were measured by western blotting in MCF-7 co-transfected with indicated siRNAs and expression plasmids. f MDA-MB-231 cells stably transfected with indicated plasmids were starved for 18 h before cell invasion assays were performed using Matrigel transwell filters. The invaded cells were stained and counted. g MDA-MB-231 cells transfected with indicated siRNAs and expression plasmids were starved for 18 h before cell invasion assays were performed using Matrigel transwell filters. The invaded cells were stained and counted. Each bar represents the mean ± S.D. for triplicate experiments. P-values were determined by Student’s t-test. *P < 0.05
Fig. 8
Fig. 8
ZNF516 suppresses the growth and metastasis of breast cancer in vivo. a MDA-MB-231-Luc-D3H2LN cells infected with lentiviruses carrying indicated plasmids were inoculated into the left abdominal mammary fat pad (5 × 106 cells) of 6-week-old immunocompromised female SCID beige mice. Tumor size was measured after 8 weeks (mammary tumors, n = 6). Lung, liver, or spleen metastases were quantified using bioluminescence imaging after 6 weeks of initial implantation, and representative in vivo bioluminescent images are shown. The efficiency of lentivirus-mediated gene expression or depletion in MDA-MB-231-Luc-D3H2LN cells was verified by western blotting. b Representative images of lung or liver sections stained with H&E are shown. Scale bar 200 μm. In all panels, each bar represents the mean ± S.D. (n = 6). P-values were determined by Student’s t-test. *P < 0.05
Fig. 9
Fig. 9
Clinicopathological relevance of ZNF516 in breast carcinomas. a Western blotting analysis of ZNF516 and EGFR expression in indicated cell lines. b Total proteins from 20 paired samples of triple-negative breast cancer (T) versus adjacent normal breast tissues (A) were extracted for western blotting analysis with antibodies against ZNF516 or EGFR. c The correlation of ZNF516 expression and histological grade using the Gene expression-based Outcome for Breast cancer Online (GOBO) analysis (http://co.bmc.lu.se/gobo/gsa.pl). The number of tumor samples in each grade is grade I (n = 239), grade II (n = 677), and grade III (n = 495). P-value is calculated using one-way ANOVA. d Analysis of TCGA data set for the correlations in mRNA expression between ZNF516 and EGFR, or CtBP1. The relative level of EGFR or CtBP1 was plotted against that of ZNF516. e Kaplan–Meier survival analysis for the relationship between survival time and ZNF516 or CtBP1 signature in breast cancer using the online tool (http://kmplot.com/analysis/). f Kaplan–Meier survival analysis of the published data sets (GSE1456) for the relationship between survival time and ZNF516/EGFR or ZNF516/CtBP1 signature in breast cancer. g Proposed model of the ZNF516-CtBP/LSD1/CoREST complex in repressing EGFR oncogene to inhibit proliferation and invasion of breast cancer cells

Similar articles

Cited by

References

    1. Lemmon MA, Schlessinger J. Cell signaling by receptor tyrosine kinases. Cell. 2010;141:1117–1134. doi: 10.1016/j.cell.2010.06.011. - DOI - PMC - PubMed
    1. Downward J, et al. Close similarity of epidermal growth factor receptor and v-erb-B oncogene protein sequences. Nature. 1984;307:521–527. doi: 10.1038/307521a0. - DOI - PubMed
    1. Chan SK, Hill ME, Gullick WJ. The role of the epidermal growth factor receptor in breast cancer. J. Mammary Gland Biol. Neoplasia. 2006;11:3–11. doi: 10.1007/s10911-006-9008-2. - DOI - PubMed
    1. Holbro T, Civenni G, Hynes NE. The ErbB receptors and their role in cancer progression. Exp. Cell Res. 2003;284:99–110. doi: 10.1016/S0014-4827(02)00099-X. - DOI - PubMed
    1. Appert-Collin A, Hubert P, Cremel G, Bennasroune A. Role of ErbB receptors in cancer cell migration and invasion. Front. Pharmacol. 2015;6:283. doi: 10.3389/fphar.2015.00283. - DOI - PMC - PubMed

Publication types

MeSH terms

LinkOut - more resources