Dynamic Changes of Genome-Wide DNA Methylation during Soybean Seed Development
- PMID: 28947812
- PMCID: PMC5613027
- DOI: 10.1038/s41598-017-12510-4
Dynamic Changes of Genome-Wide DNA Methylation during Soybean Seed Development
Erratum in
-
Author Correction: Dynamic Changes of Genome-Wide DNA Methylation during Soybean Seed Development.Sci Rep. 2018 May 15;8(1):7882. doi: 10.1038/s41598-018-25805-x. Sci Rep. 2018. PMID: 29760503 Free PMC article.
Abstract
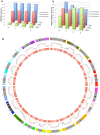
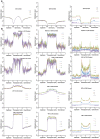
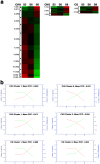
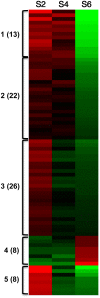
Seed development is programmed by expression of many genes in plants. Seed maturation is an important developmental process to soybean seed quality and yield. DNA methylation is a major epigenetic modification regulating gene expression. However, little is known about the dynamic nature of DNA methylation and its effects on gene expression during plant development. Through whole-genome bisulfite sequencing, we showed that DNA methylation went through dynamic changes during seed maturation. An average of 66% CG, 45% CHG and 9% CHH contexts was methylated in cotyledons. CHH methylation levels in cotyledons changed greatly from 6% at the early stage to 11% at the late stage. Transcribed genes were approximately two-fold more likely to be differentially methylated than non-transcribed genes. We identified 40, 66 and 2136 genes containing differentially methylated regions (DMRs) with negative correlation between their expression and methylation in the CG, CHG and CHH contexts, respectively. The majority of the DMR genes in the CHH context were transcriptionally down-regulated as seeds mature: 99% of them during early maturation were down-regulated, and preferentially associated with DNA replication and cell division. The results provide novel insights into the dynamic nature of DNA methylation and its relationship with gene regulation in seed development.
Conflict of interest statement
The authors declare that they have no competing interests.
Figures


Similar articles
-
Similarity between soybean and Arabidopsis seed methylomes and loss of non-CG methylation does not affect seed development.Proc Natl Acad Sci U S A. 2017 Nov 7;114(45):E9730-E9739. doi: 10.1073/pnas.1716758114. Epub 2017 Oct 23. Proc Natl Acad Sci U S A. 2017. PMID: 29078418 Free PMC article.
-
Seed genome hypomethylated regions are enriched in transcription factor genes.Proc Natl Acad Sci U S A. 2018 Aug 28;115(35):E8315-E8322. doi: 10.1073/pnas.1811017115. Epub 2018 Aug 13. Proc Natl Acad Sci U S A. 2018. PMID: 30104383 Free PMC article.
-
Genome-wide high-resolution mapping of DNA methylation reveals epigenetic variation in the offspring of sexual and asexual propagation in Robinia pseudoacacia.Plant Cell Rep. 2021 Dec;40(12):2435-2447. doi: 10.1007/s00299-021-02787-1. Epub 2021 Sep 15. Plant Cell Rep. 2021. PMID: 34524479
-
Dynamic DNA Methylation in Plant Growth and Development.Int J Mol Sci. 2018 Jul 23;19(7):2144. doi: 10.3390/ijms19072144. Int J Mol Sci. 2018. PMID: 30041459 Free PMC article. Review.
-
DNA methylation in higher plants: past, present and future.Biochim Biophys Acta. 2011 Aug;1809(8):360-8. doi: 10.1016/j.bbagrm.2011.04.006. Epub 2011 Apr 28. Biochim Biophys Acta. 2011. PMID: 21549230 Review.
Cited by
-
Dynamics of DNA Methylation and Its Functions in Plant Growth and Development.Front Plant Sci. 2021 May 21;12:596236. doi: 10.3389/fpls.2021.596236. eCollection 2021. Front Plant Sci. 2021. PMID: 34093600 Free PMC article. Review.
-
Small RNA-mediated DNA methylation during plant reproduction.Plant Cell. 2023 May 29;35(6):1787-1800. doi: 10.1093/plcell/koad010. Plant Cell. 2023. PMID: 36651080 Free PMC article. Review.
-
Quantitative Epigenetics: A New Avenue for Crop Improvement.Epigenomes. 2020 Nov 7;4(4):25. doi: 10.3390/epigenomes4040025. Epigenomes. 2020. PMID: 34968304 Free PMC article. Review.
-
Post-transcriptional regulation of seed dormancy and germination: Current understanding and future directions.Plant Commun. 2021 Feb 18;2(4):100169. doi: 10.1016/j.xplc.2021.100169. eCollection 2021 Jul 12. Plant Commun. 2021. PMID: 34327318 Free PMC article. Review.
-
Transition from Seeds to Seedlings: Hormonal and Epigenetic Aspects.Plants (Basel). 2021 Sep 11;10(9):1884. doi: 10.3390/plants10091884. Plants (Basel). 2021. PMID: 34579418 Free PMC article. Review.
References
Publication types
MeSH terms
Substances
LinkOut - more resources
Full Text Sources
Other Literature Sources

