

Microenvironment regulates the expression of miR-21 and tumor suppressor genes PTEN, PIAS3 and PDCD4 through ZAP-70 in chronic lymphocytic leukemia
- PMID: 28947822
- PMCID: PMC5612928
- DOI: 10.1038/s41598-017-12135-7
Microenvironment regulates the expression of miR-21 and tumor suppressor genes PTEN, PIAS3 and PDCD4 through ZAP-70 in chronic lymphocytic leukemia
Abstract
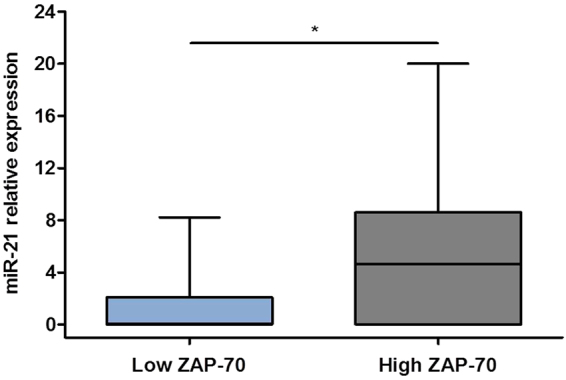
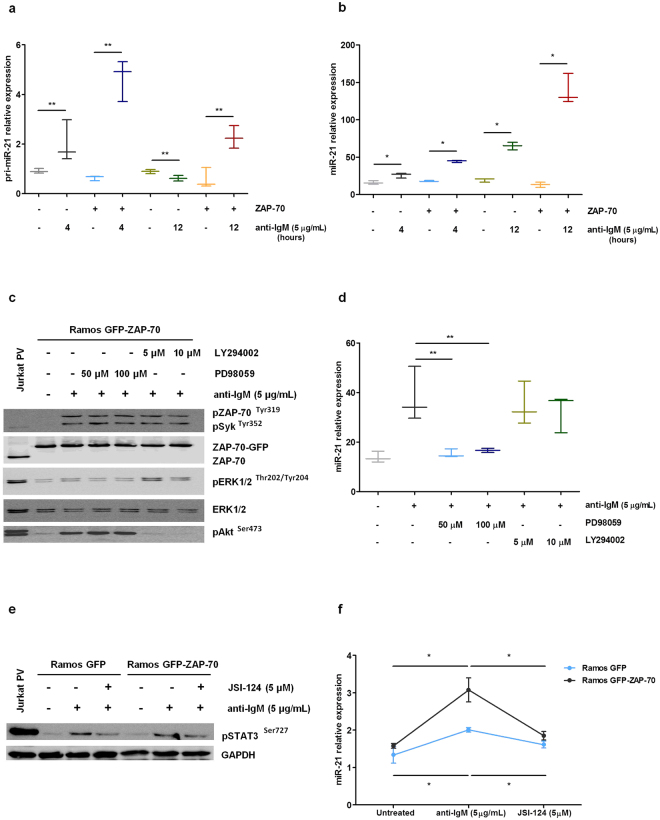
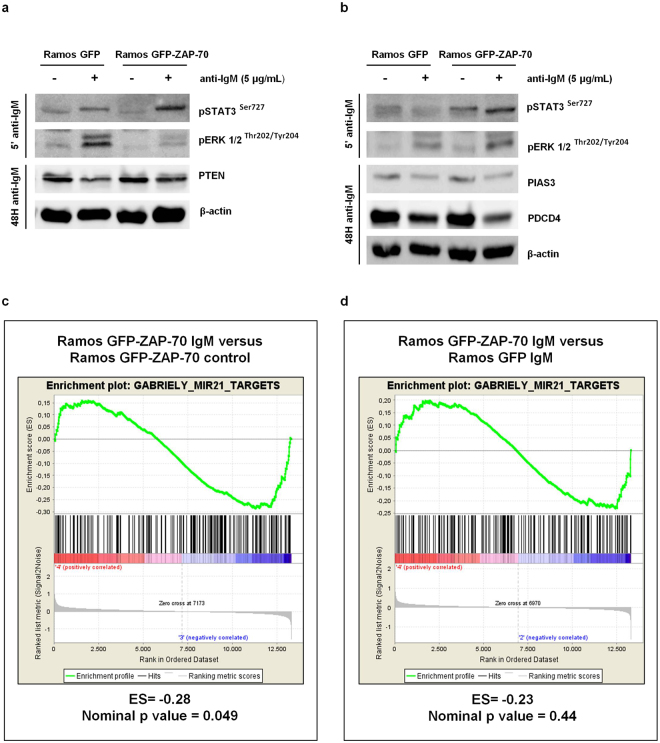
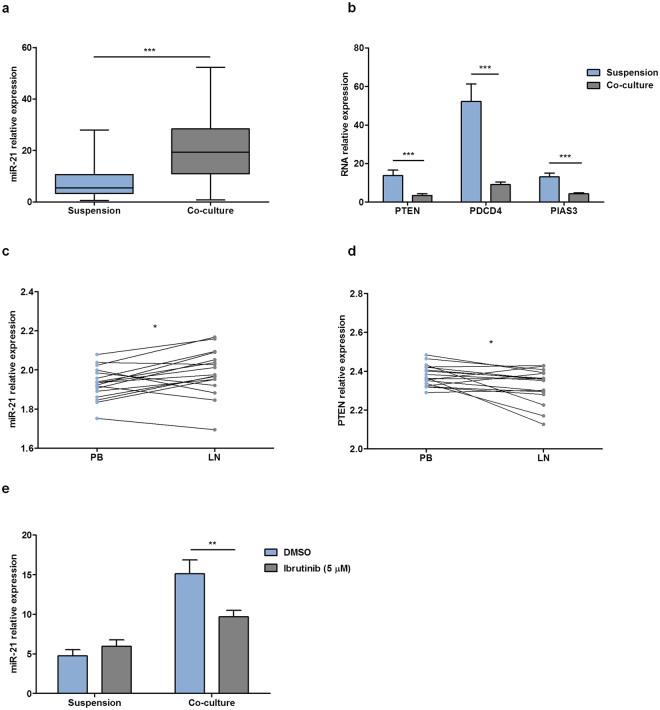
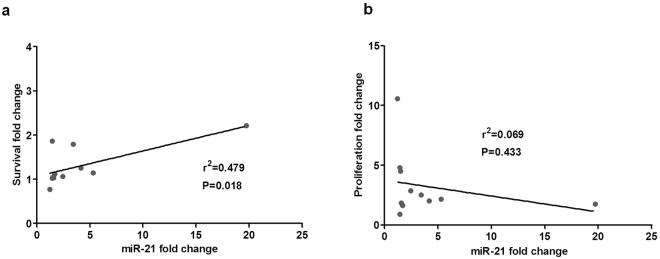
Chronic lymphocytic leukemia (CLL) cells are highly dependent on microenvironment, being the BCR pathway one key player in this crosstalk. Among proteins participating, ZAP-70 enhances response to microenvironmental stimuli. MicroRNA-21 (miR-21) is overexpressed in diverse neoplasias including CLL, where it has been associated to refractoriness to fludarabine and to shorter time to progression and survival. To further elucidate the role of ZAP-70 in the biology of CLL, we studied its involvement in miR-21 regulation. MiR-21 expression was higher in CLL cells with high ZAP-70. Ectopic expression of ZAP-70 induced transcription of miR-21 via MAPK and STAT3, which subsequently induced downregulation of tumor suppressors targeted by miR-21. The co-culture of primary CLL cells mimicking the microenvironment induced ZAP-70 and miR-21 expression, as well as downregulation of miR-21 targets. Interestingly, the increase in miR-21 after co-culture was significantly impaired by ibrutinib, indicating that the BCR signaling pathway is involved in its regulation. Finally, survival of CLL cells induced by the co-culture correlated with miR-21 upregulation. In conclusion, stimuli from the microenvironment regulate miR-21 and its targeted tumor suppressor genes via a signaling pathway involving ZAP-70, thus contributing to the cytoprotection offered by the microenvironment particularly observed in CLL cells expressing ZAP-70.
Conflict of interest statement
The authors declare that they have no competing interests.
Figures
Similar articles
-
Inhibition of BCR signaling using the Syk inhibitor TAK-659 prevents stroma-mediated signaling in chronic lymphocytic leukemia cells.Oncotarget. 2017 Jan 3;8(1):742-756. doi: 10.18632/oncotarget.13557. Oncotarget. 2017. PMID: 27888629 Free PMC article.
-
MicroRNA-155 influences B-cell receptor signaling and associates with aggressive disease in chronic lymphocytic leukemia.Blood. 2014 Jul 24;124(4):546-54. doi: 10.1182/blood-2014-03-559690. Epub 2014 Jun 9. Blood. 2014. PMID: 24914134 Free PMC article.
-
The miR-17∼92 family regulates the response to Toll-like receptor 9 triggering of CLL cells with unmutated IGHV genes.Leukemia. 2012 Jul;26(7):1584-93. doi: 10.1038/leu.2012.44. Epub 2012 Feb 20. Leukemia. 2012. PMID: 22343732
-
Pitfalls and limitations of ZAP-70 detection in chronic lymphocytic leukemia.Hematology. 2012 Sep;17(5):268-74. doi: 10.1179/1607845412Y.0000000015. Hematology. 2012. PMID: 22971532 Review.
-
Role of spleen tyrosine kinase in the pathogenesis of chronic lymphocytic leukemia.Leuk Lymphoma. 2014 Dec;55(12):2699-705. doi: 10.3109/10428194.2014.891026. Epub 2014 Mar 18. Leuk Lymphoma. 2014. PMID: 24547708 Review.
Cited by
-
Ibrutinib Resistance Mechanisms and Treatment Strategies for B-Cell lymphomas.Cancers (Basel). 2020 May 22;12(5):1328. doi: 10.3390/cancers12051328. Cancers (Basel). 2020. PMID: 32455989 Free PMC article. Review.
-
Simultaneous Targeting of Multiple oncomiRs with Phosphorothioate or PNA-Based Anti-miRs in Lymphoma Cell Lines.Pharm Res. 2022 Nov;39(11):2709-2720. doi: 10.1007/s11095-022-03383-y. Epub 2022 Sep 7. Pharm Res. 2022. PMID: 36071352 Free PMC article.
-
Targeted inhibition of mRNA translation initiation factors as a novel therapeutic strategy for mature B-cell neoplasms.Explor Target Antitumor Ther. 2020 Feb 29;1(1):3-25. doi: 10.37349/etat.2020.00002. Explor Target Antitumor Ther. 2020. PMID: 32924027 Free PMC article.
-
DEX-Induced SREBF1 Promotes BMSCs Differentiation into Adipocytes to Attract and Protect Residual T-Cell Acute Lymphoblastic Leukemia Cells After Chemotherapy.Adv Sci (Weinh). 2023 Jul;10(19):e2205854. doi: 10.1002/advs.202205854. Epub 2023 Apr 18. Adv Sci (Weinh). 2023. PMID: 37072664 Free PMC article.
-
miR-106b promotes proliferation and invasion by targeting Capicua through MAPK signaling in renal carcinoma cancer.Onco Targets Ther. 2019 May 13;12:3595-3607. doi: 10.2147/OTT.S184674. eCollection 2019. Onco Targets Ther. 2019. PMID: 31190862 Free PMC article.
References
-
- Damle RN, et al. Ig V gene mutation status and CD38 expression as novel prognostic indicators in chronic lymphocytic leukemia. Blood. 1999;94:1840–1847. - PubMed
Publication types
MeSH terms
Substances
LinkOut - more resources
Full Text Sources
Other Literature Sources
Research Materials
Miscellaneous
