

Modulation of Dendritic Cell Apoptosis and CD8+ Cytotoxicity by Histamine: Role of Protein Kinase C
- PMID: 28947859
- PMCID: PMC5602510
- DOI: 10.1155/2017/9402814
Modulation of Dendritic Cell Apoptosis and CD8+ Cytotoxicity by Histamine: Role of Protein Kinase C
Abstract
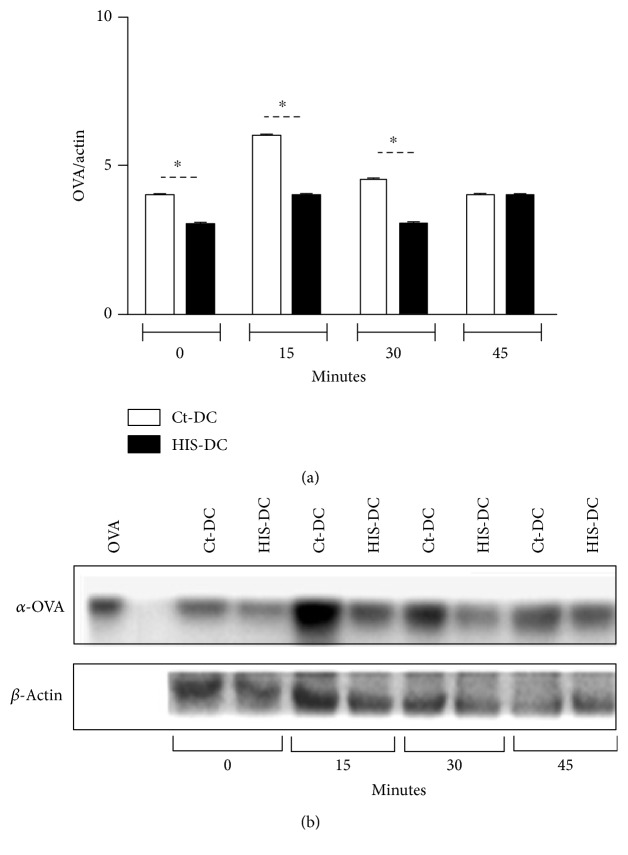
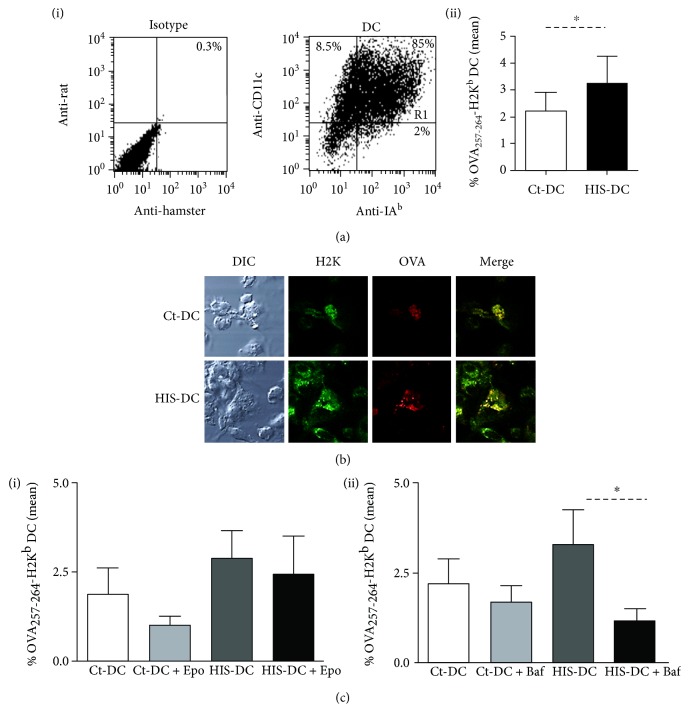
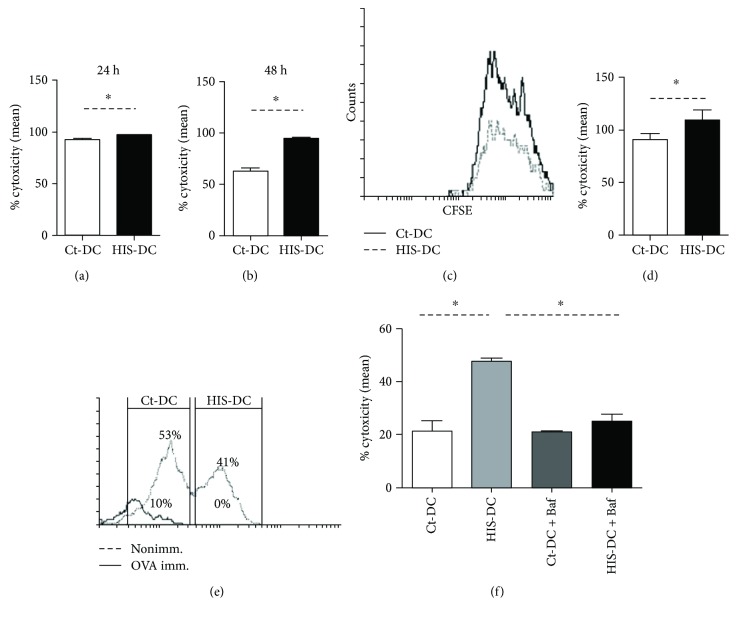
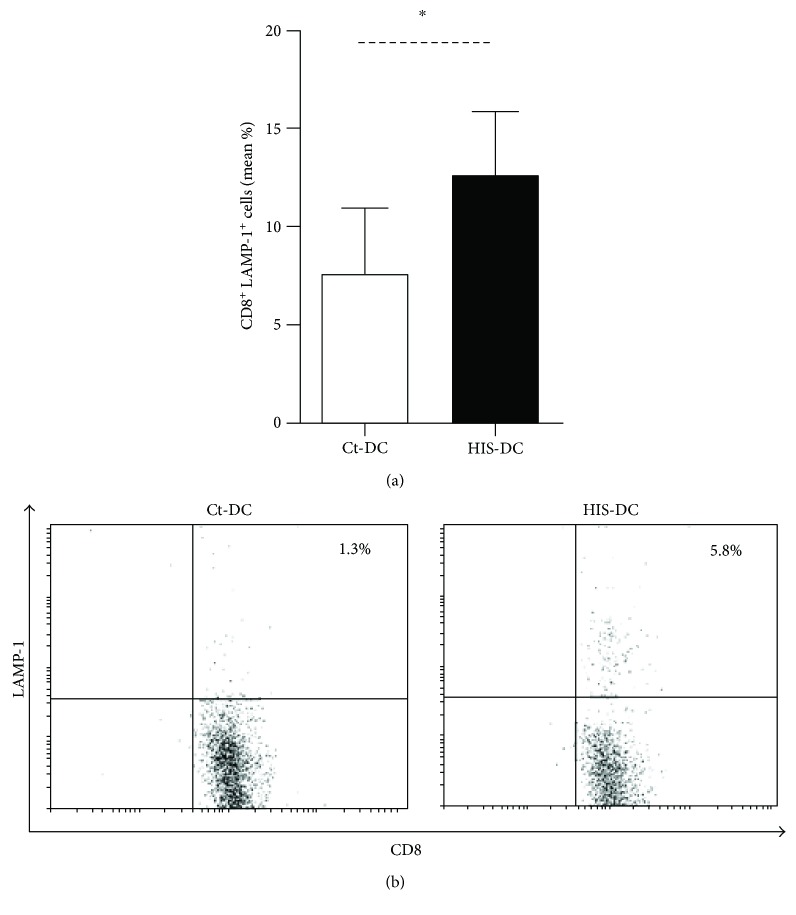
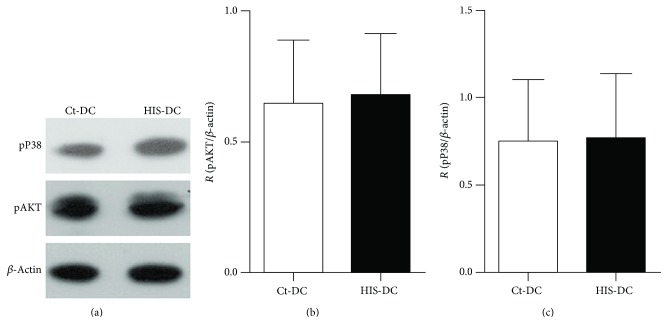
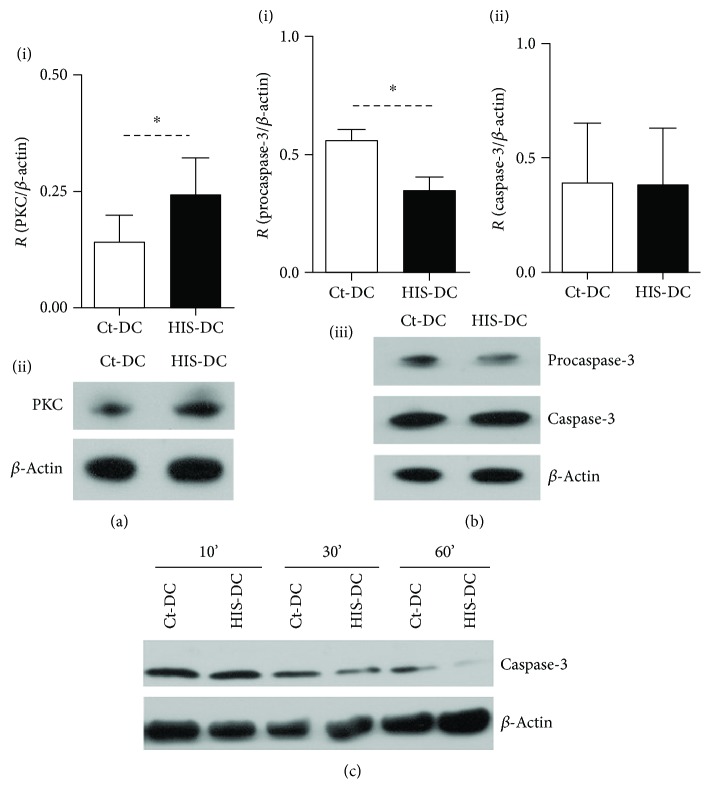
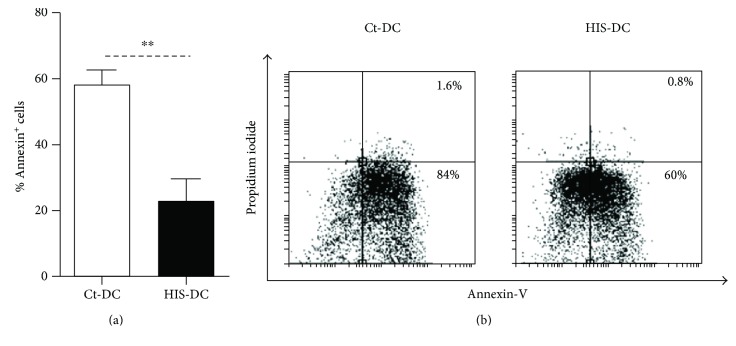
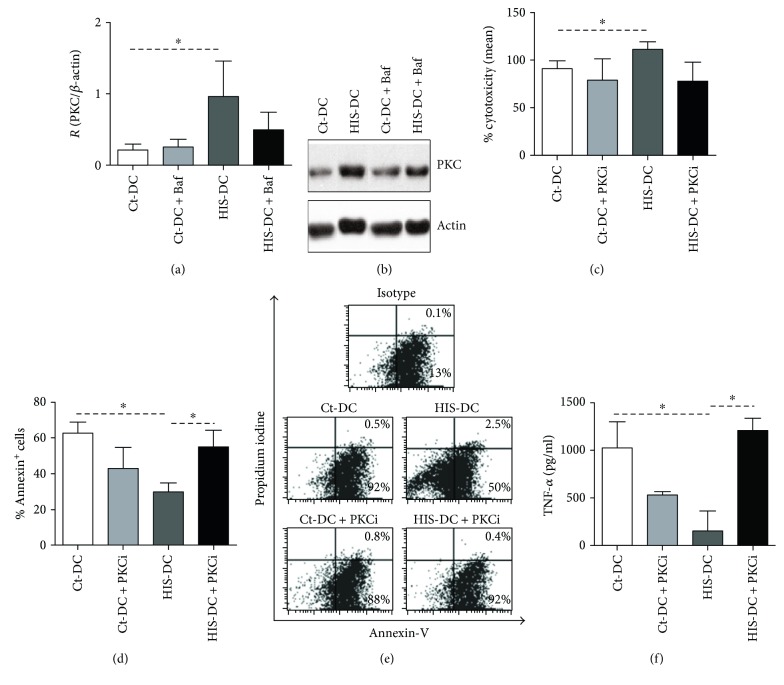
Dendritic cells (DC) are able to present extracellular antigens associated with the molecules of the major histocompatibility complex class I. In a previous work, we demonstrated that the histamine (HIS), acting through H1/H4 receptors, increases the cross-presentation of soluble ovalbumin by murine DC and can enhance the recruitment of specific CD8+ T lymphocytes during the development of chronic inflammatory responses. Here, we studied in more depth the mechanisms underlying this enhancement. We showed that the cytotoxicity of specific CD8+ lymphocytes is increased in HIS-treated DC and it is lost by inhibition of vacuolar-ATPase that prevents endosome acidification. It is known that HIS acts through G protein-coupled receptors. The H1/H4 receptors are associated with a Gq subunit, which involves PKC signaling, a pathway related to the apoptotic process. Interestingly, we demonstrated for the first time that HIS prevents DC apoptosis induced by heat shock through the inhibition of caspase-3, a mechanism dependent on PKC activation, since it is reversed by its inhibition. By contrast, cytolytic activity of T lymphocytes induced by HIS-stimulated DC was independent of PKC pathway.
Figures
Similar articles
-
Dendritic cells recruit T cell exosomes via exosomal LFA-1 leading to inhibition of CD8+ CTL responses through downregulation of peptide/MHC class I and Fas ligand-mediated cytotoxicity.J Immunol. 2010 Nov 1;185(9):5268-78. doi: 10.4049/jimmunol.1000386. Epub 2010 Sep 29. J Immunol. 2010. PMID: 20881190
-
Extracellular heat shock protein 90 plays a role in translocating chaperoned antigen from endosome to proteasome for generating antigenic peptide to be cross-presented by dendritic cells.Int Immunol. 2011 Apr;23(4):223-37. doi: 10.1093/intimm/dxq475. Epub 2011 Mar 18. Int Immunol. 2011. PMID: 21421737
-
Flt3L-mobilized dendritic cells bearing H2-Kbm1 apoptotic cells do not induce cross-tolerance to CD8+ T cells across a class I MHC mismatched barrier.Transpl Int. 2011 May;24(5):501-13. doi: 10.1111/j.1432-2277.2011.01220.x. Epub 2011 Jan 29. Transpl Int. 2011. PMID: 21276089
-
Antitumour activity mediated by CD4+ cytotoxic T lymphocytes against MHC class II-negative mouse hepatocellular carcinoma induced by dendritic cell vaccine and interleukin-12.Immunology. 2005 Aug;115(4):451-61. doi: 10.1111/j.1365-2567.2005.02179.x. Immunology. 2005. PMID: 16011514 Free PMC article.
-
Langerin+ CD8alpha+ dendritic cells are critical for cross-priming and IL-12 production in response to systemic antigens.J Immunol. 2009 Dec 15;183(12):7732-42. doi: 10.4049/jimmunol.0902707. J Immunol. 2009. PMID: 19923446
Cited by
-
Mechanisms of unconventional CD8 Tc2 lymphocyte induction in allergic contact dermatitis: Role of H3/H4 histamine receptors.Front Immunol. 2022 Oct 7;13:999852. doi: 10.3389/fimmu.2022.999852. eCollection 2022. Front Immunol. 2022. PMID: 36275674 Free PMC article.
-
Type 2 immunity in allergic diseases.Cell Mol Immunol. 2025 Mar;22(3):211-242. doi: 10.1038/s41423-025-01261-2. Epub 2025 Feb 17. Cell Mol Immunol. 2025. PMID: 39962262 Free PMC article. Review.
-
Crosstalk between Dendritic Cells and Immune Modulatory Agents against Sepsis.Genes (Basel). 2020 Mar 18;11(3):323. doi: 10.3390/genes11030323. Genes (Basel). 2020. PMID: 32197507 Free PMC article. Review.
-
CD8 T-cell subsets: heterogeneity, functions, and therapeutic potential.Exp Mol Med. 2023 Nov;55(11):2287-2299. doi: 10.1038/s12276-023-01105-x. Epub 2023 Nov 1. Exp Mol Med. 2023. PMID: 37907738 Free PMC article. Review.
References
-
- Jutel M., Watanabe T., Akdis M., Blaser K., Akdis C. A. Immune regulation by histamine. Current Opinion in Immunology. 2002;14(6):735–740. - PubMed
MeSH terms
Substances
LinkOut - more resources
Full Text Sources
Other Literature Sources
Research Materials
