

Increased Bcl-xL Expression in Pancreatic Neoplasia Promotes Carcinogenesis by Inhibiting Senescence and Apoptosis
- PMID: 28948203
- PMCID: PMC5604117
- DOI: 10.1016/j.jcmgh.2017.02.001
Increased Bcl-xL Expression in Pancreatic Neoplasia Promotes Carcinogenesis by Inhibiting Senescence and Apoptosis
Abstract
Background & aims: Bcl-xL, an anti-apoptotic Bcl-2 family protein, is overexpressed in 90% of pancreatic ductal adenocarcinoma (PDAC) cases. However, Bcl-xL expression in pancreatic intraepithelial neoplasias (PanINs) and its significance in PDAC carcinogenesis remain unclear. The aim of this study was to elucidate the significance of Bcl-xL expression in PanINs.
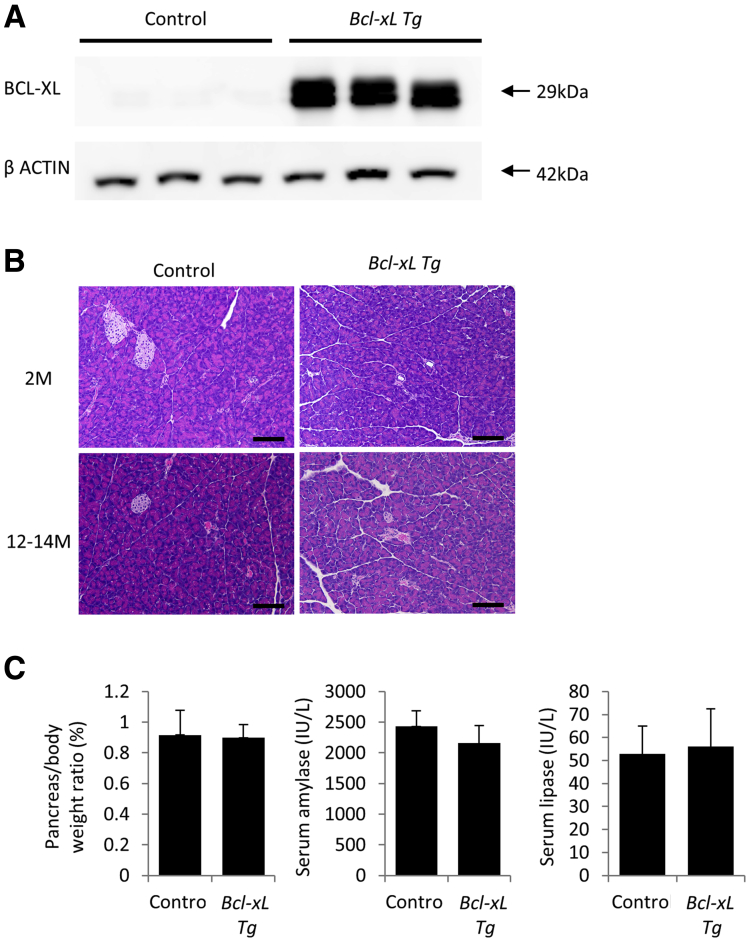
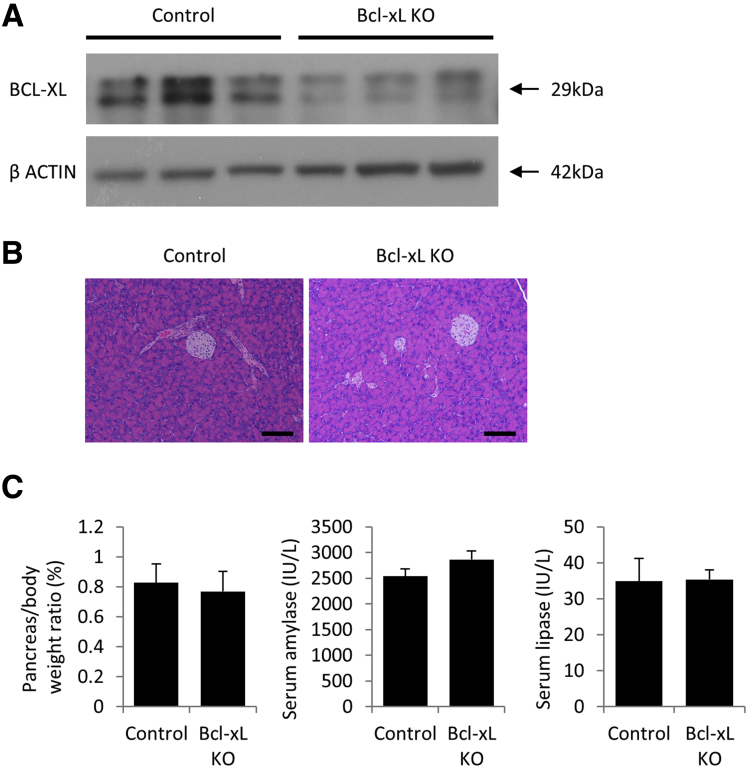
Methods: We investigated the expression levels of Bcl-xL in pancreas-specific KrasG12D (P-KrasG12D) mice and human PanINs and PDAC. We examined the impact of Bcl-xL expression on Kras-mutated pancreatic neoplasia using Bcl-xL-overexpressing P-KrasG12D mice and Bcl-xL-knockout P-KrasG12D mice.
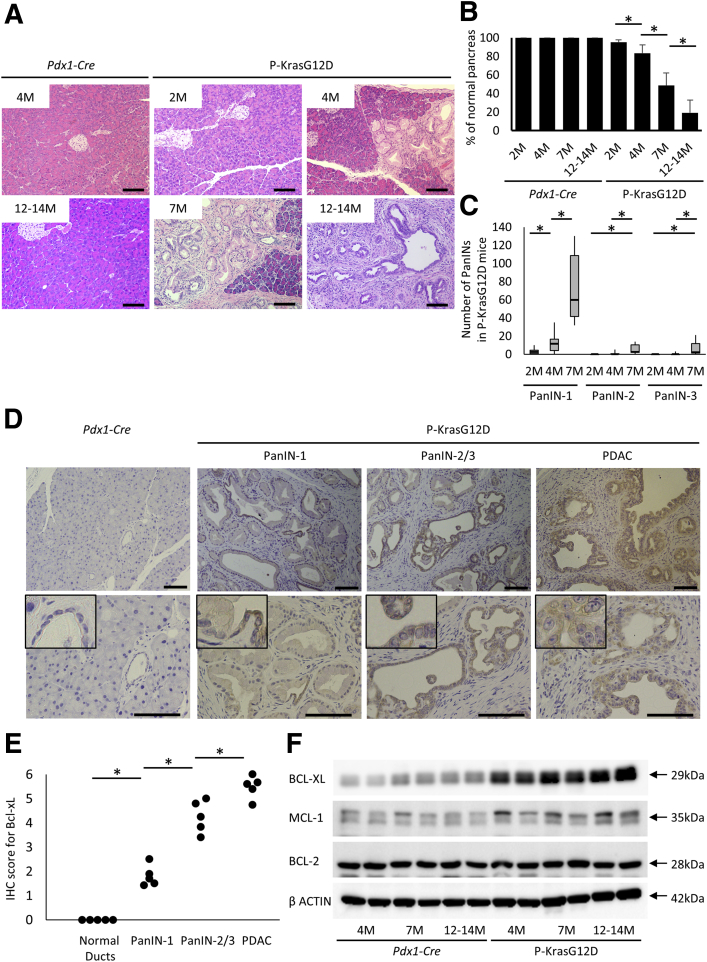
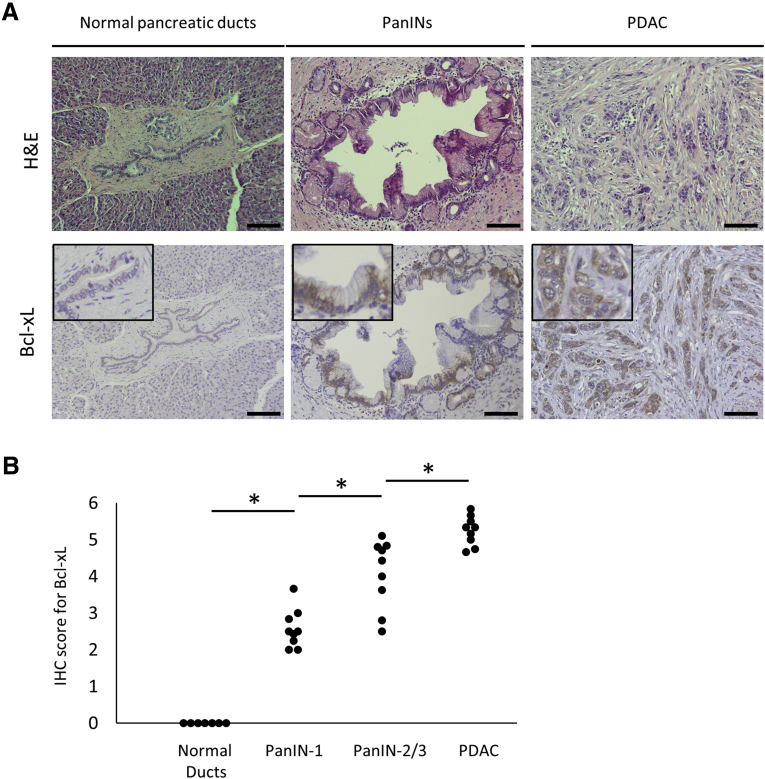
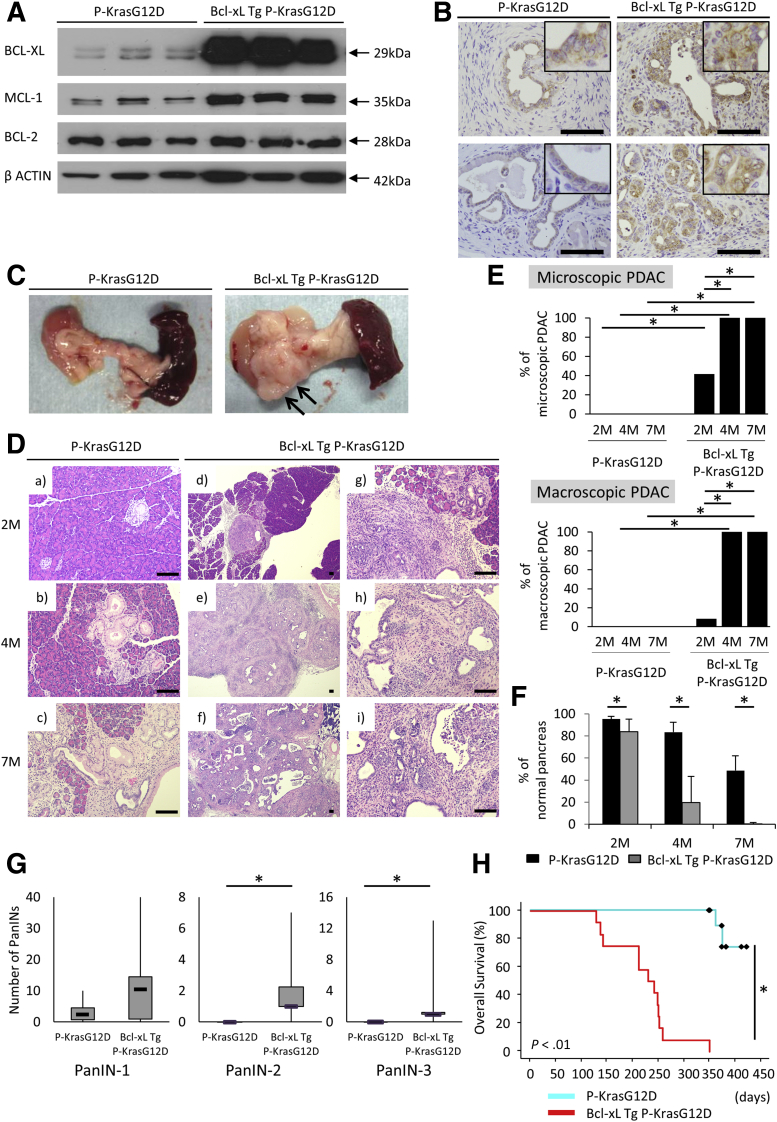
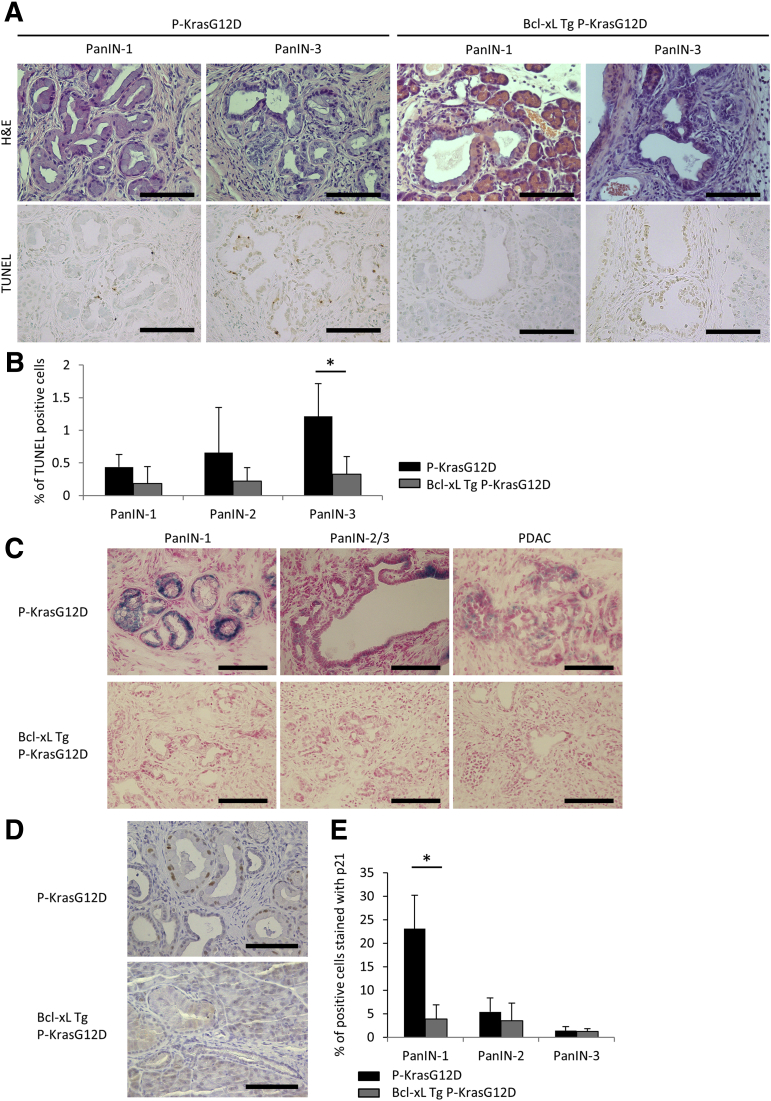
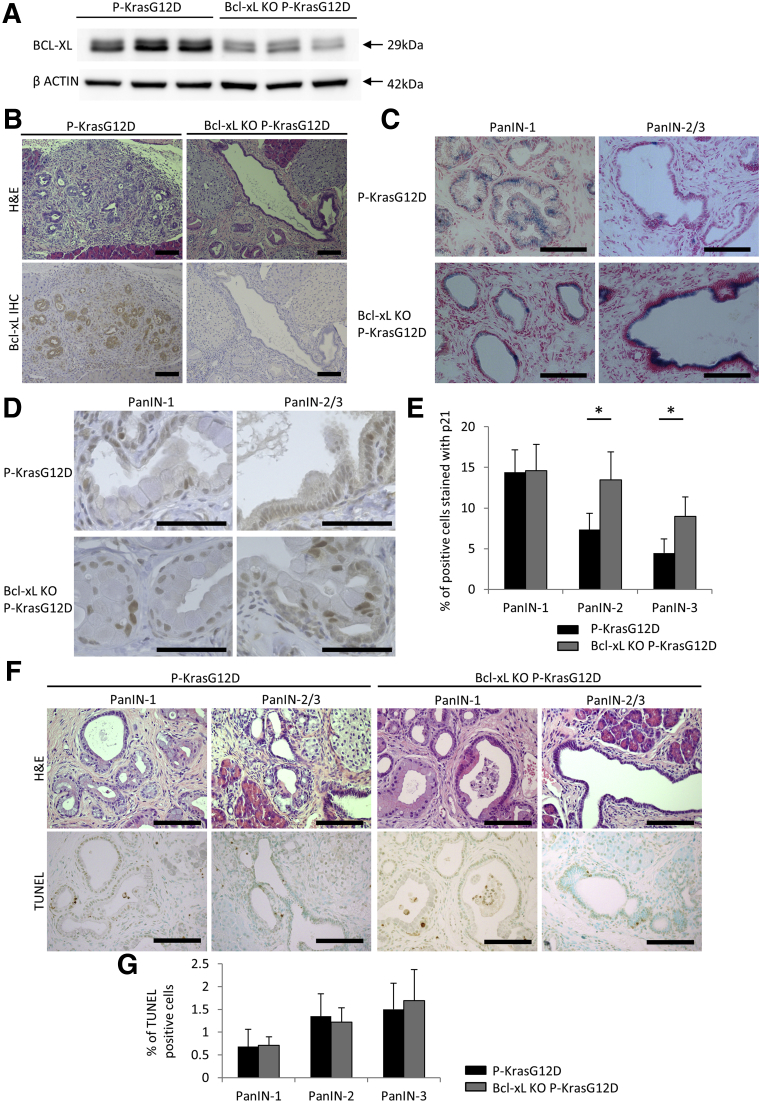
Results: In P-KrasG12D mice, the number of PanINs increased and their grades progressed with age. In total, 55.6% of these mice developed PDAC at 12-14 months. According to the immunohistochemistry of mouse pancreas and human resected specimens, Bcl-xL expression was increased significantly in PanIN-1 compared with that in normal pancreatic ducts, and augmented further with the progression of pancreatic neoplasia in PanIN-2/3 and PDAC. Oncogene-induced senescence was observed frequently in PanIN-1, but rarely was detected in PanIN-2/3 and PDAC. Bcl-xL overexpression significantly accelerated the progression to high-grade PanINs and PDAC and reduced the survival of P-KrasG12D mice. Bcl-xL overexpression in P-KrasG12D mice suppressed oncogene-induced senescence in PanIN-1 and inhibited apoptosis in PanIN-3. Bcl-xL deficiency in P-KrasG12D mice induced cellular senescence in PanIN-2/3.
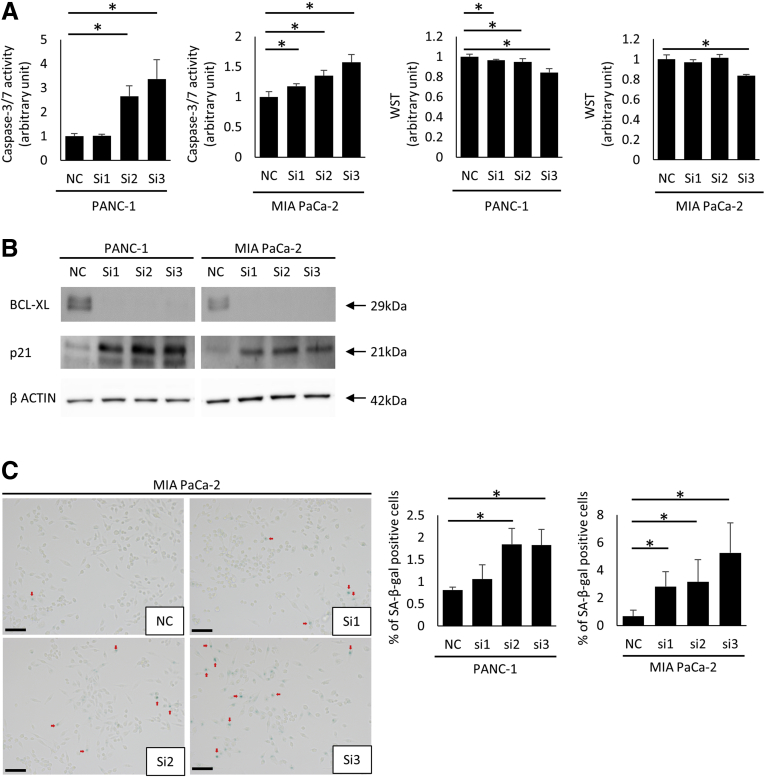
Conclusions: Bcl-xL expression increases with the progression from PanIN-1 to PDAC, whereas oncogene-induced senescence decreases. Bcl-xL overexpression increases PDAC incidence rates by inhibiting oncogene-induced senescence and apoptosis in PanINs. Conversely, Bcl-xL deficiency induced senescence in PanINs. Anti-Bcl-xL treatments may have the potency to suppress the progression from PanINs to PDAC.
Keywords: Bcl-2 Family Protein; IHC, immunohistochemistry; KO, knockout; Kras; P-KrasG12D, Pdx1-Cre LSL-KrasG12D; PDAC, pancreatic ductal adenocarcinoma; PanIN, pancreatic intraepithelial neoplasia; PanINs; SA–β-gal, senescence-associated β-galactosidase; TUNEL, terminal deoxynucleotidyl transferase–mediated deoxyuridine triphosphate nick-end labeling; Tg, transgenic; siRNA, small interfering RNA.
Figures
Similar articles
-
The biological features of PanIN initiated from oncogenic Kras mutation in genetically engineered mouse models.Cancer Lett. 2013 Oct 1;339(1):135-43. doi: 10.1016/j.canlet.2013.07.010. Epub 2013 Jul 22. Cancer Lett. 2013. PMID: 23887057
-
A high-fat diet activates oncogenic Kras and COX2 to induce development of pancreatic ductal adenocarcinoma in mice.Gastroenterology. 2013 Dec;145(6):1449-58. doi: 10.1053/j.gastro.2013.08.018. Epub 2013 Aug 16. Gastroenterology. 2013. PMID: 23958541 Free PMC article.
-
Low Incidence of High-Grade Pancreatic Intraepithelial Neoplasia Lesions in a Crmp4 Gene-Deficient Mouse Model of Pancreatic Cancer.Transl Oncol. 2020 Mar;13(3):100746. doi: 10.1016/j.tranon.2020.100746. Epub 2020 Feb 24. Transl Oncol. 2020. PMID: 32105991 Free PMC article.
-
Pancreatic Intraepithelial Neoplasia.Surg Pathol Clin. 2011 Jun;4(2):523-35. doi: 10.1016/j.path.2011.03.005. Epub 2011 May 30. Surg Pathol Clin. 2011. PMID: 26837486 Review.
-
Pancreatic intraepithelial neoplasia revisited and updated.Pancreatology. 2009;9(1-2):45-54. doi: 10.1159/000178874. Epub 2008 Dec 12. Pancreatology. 2009. PMID: 19077454 Review.
Cited by
-
Targeting BCL-XL in fibrolamellar hepatocellular carcinoma.JCI Insight. 2022 Sep 8;7(17):e161820. doi: 10.1172/jci.insight.161820. JCI Insight. 2022. PMID: 36073545 Free PMC article.
-
Bioinformatic Analysis of the BCL-xL/BCL2L1 Interactome in Patients with Pancreatic Cancer.Medicina (Kaunas). 2022 Nov 17;58(11):1663. doi: 10.3390/medicina58111663. Medicina (Kaunas). 2022. PMID: 36422202 Free PMC article.
-
Modulation of tumor plasticity by senescent cells: Deciphering basic mechanisms and survival pathways to unravel therapeutic options.Genet Mol Biol. 2024 May 27;47Suppl 1(Suppl 1):e20230311. doi: 10.1590/1678-4685-GMB-2023-0311. eCollection 2024. Genet Mol Biol. 2024. PMID: 38805699 Free PMC article.
-
The Role of Mitochondria in the Chemoresistance of Pancreatic Cancer Cells.Cells. 2021 Feb 25;10(3):497. doi: 10.3390/cells10030497. Cells. 2021. PMID: 33669111 Free PMC article. Review.
-
Photodynamic Therapy Using a Novel Phosphorus Tetraphenylporphyrin Induces an Anticancer Effect via Bax/Bcl-xL-related Mitochondrial Apoptosis in Biliary Cancer Cells.Acta Histochem Cytochem. 2020 Aug 26;53(4):61-72. doi: 10.1267/ahc.20-00002. Epub 2020 Jul 4. Acta Histochem Cytochem. 2020. PMID: 32873990 Free PMC article.
References
-
- Jemal A., Bray F., Center M.M., Ferlay J., Ward E., Forman D. Global cancer statistics. CA Cancer J Clin. 2011;61:69–90. - PubMed
-
- Siegel R.L., Miller K.D., Jemal A. Cancer statistics, 2016. CA Cancer J Clin. 2016;66:7–30. - PubMed
-
- Scarlett C.J., Salisbury E.L., Biankin A.V., Kench J. Precursor lesions in pancreatic cancer: morphological and molecular pathology. Pathology. 2011;43:183–200. - PubMed
-
- Basturk O., Hong S.M., Wood L.D., Adsay N.V., Albores-Saavedra J., Biankin A.V., Brosens L.A., Fukushima N., Goggins M., Hruban R.H., Kato Y., Klimstra D.S., Klöppel G., Krasinskas A., Longnecker D.S., Matthaei H., Offerhaus G.J., Shimizu M., Takaori K., Terris B., Yachida S., Esposito I., Furukawa T., Baltimore Consensus Meeting A revised classification system and recommendations from the Baltimore consensus meeting for neoplastic precursor lesions in the pancreas. Am J Surg Pathol. 2015;39:1730–1741. - PMC - PubMed
LinkOut - more resources
Full Text Sources
Other Literature Sources
Research Materials
Miscellaneous
