Global sea turtle conservation successes
- PMID: 28948215
- PMCID: PMC5606703
- DOI: 10.1126/sciadv.1600730
Global sea turtle conservation successes
Abstract
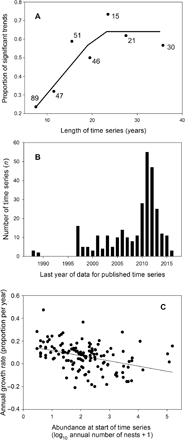
We document a tendency for published estimates of population size in sea turtles to be increasing rather than decreasing across the globe. To examine the population status of the seven species of sea turtle globally, we obtained 299 time series of annual nesting abundance with a total of 4417 annual estimates. The time series ranged in length from 6 to 47 years (mean, 16.2 years). When levels of abundance were summed within regional management units (RMUs) for each species, there were upward trends in 12 RMUs versus downward trends in 5 RMUs. This prevalence of more upward than downward trends was also evident in the individual time series, where we found 95 significant increases in abundance and 35 significant decreases. Adding to this encouraging news for sea turtle conservation, we show that even small sea turtle populations have the capacity to recover, that is, Allee effects appear unimportant. Positive trends in abundance are likely linked to the effective protection of eggs and nesting females, as well as reduced bycatch. However, conservation concerns remain, such as the decline in leatherback turtles in the Eastern and Western Pacific. Furthermore, we also show that, often, time series are too short to identify trends in abundance. Our findings highlight the importance of continued conservation and monitoring efforts that underpin this global conservation success story.
Figures


Similar articles
-
A pulse check for trends in sea turtle numbers across the globe.iScience. 2024 Feb 15;27(3):109071. doi: 10.1016/j.isci.2024.109071. eCollection 2024 Mar 15. iScience. 2024. PMID: 38524373 Free PMC article.
-
Cost-effectiveness of alternative conservation strategies with application to the Pacific leatherback turtle.Conserv Biol. 2014 Feb;28(1):140-9. doi: 10.1111/cobi.12239. Epub 2014 Jan 9. Conserv Biol. 2014. PMID: 24405417
-
Interannual differences for sea turtles bycatch in Spanish longliners from Western Mediterranean Sea.ScientificWorldJournal. 2014 Feb 10;2014:861396. doi: 10.1155/2014/861396. eCollection 2014. ScientificWorldJournal. 2014. PMID: 24764769 Free PMC article.
-
Putting longline bycatch of sea turtles into perspective.Conserv Biol. 2007 Feb;21(1):79-86. doi: 10.1111/j.1523-1739.2006.00592.x. Conserv Biol. 2007. PMID: 17298513 Review.
-
Biology, Nesting Behavior, Genetic Diversity, and Conservation of Leatherback Sea Turtles: Insights From Thailand and Global Perspectives.Ecol Evol. 2025 Feb 20;15(2):e71014. doi: 10.1002/ece3.71014. eCollection 2025 Feb. Ecol Evol. 2025. PMID: 39991445 Free PMC article. Review.
Cited by
-
Origins of juvenile green sea turtles (Chelonia mydas) in the Bahamas: A comparison of recent and historical rookery contributions.Ecol Evol. 2022 Nov 27;12(11):e9548. doi: 10.1002/ece3.9548. eCollection 2022 Nov. Ecol Evol. 2022. PMID: 36447590 Free PMC article.
-
Trends in Reproductive Indicators of Green and Hawksbill Sea Turtles over a 30-Year Monitoring Period in the Southern Gulf of Mexico and Their Conservation Implications.Animals (Basel). 2022 Nov 24;12(23):3280. doi: 10.3390/ani12233280. Animals (Basel). 2022. PMID: 36496800 Free PMC article.
-
Optimism for mitigation of climate warming impacts for sea turtles through nest shading and relocation.Sci Rep. 2018 Dec 4;8(1):17625. doi: 10.1038/s41598-018-35821-6. Sci Rep. 2018. PMID: 30514853 Free PMC article.
-
Forty years of monitoring increasing sea turtle relative abundance in the Gulf of Mexico.Sci Rep. 2023 Oct 11;13(1):17213. doi: 10.1038/s41598-023-43651-4. Sci Rep. 2023. PMID: 37821522 Free PMC article.
-
A preliminary investigation into the early embryo death syndrome (EEDS) at the world's largest green turtle rookery.PLoS One. 2018 Apr 25;13(4):e0195462. doi: 10.1371/journal.pone.0195462. eCollection 2018. PLoS One. 2018. PMID: 29694365 Free PMC article.
References
-
- Barnosky A. D., Matzke N., Tomiya S., Wogan G. O. U., Swartz B., Quental T. B., Marshall C., McGuire J. L., Lindsey E. L., Maguire K. C., Mersey B., Ferrer E. A., Has the Earth’s sixth mass extinction already arrived? Nature 471, 51–57 (2011). - PubMed
-
- Stuart S. N., Chanson J. S., Cox N. A., Young B. E., Rodrigues A. S. L., Fischman D. L., Waller R. W., Status and trends of amphibian declines and extinctions worldwide. Science 306, 1783–1786 (2004). - PubMed
-
- Ripple W. J., Estes J. A., Beschta R. L., Wilmers C. C., Ritchie E. G., Hebblewhite M., Berger J., Elmhagen B., Letnic M., Nelson M. P., Schmitz O. J., Smith D. W., Wallach A. D., Wirsing A. J., Status and ecological effects of the world’s largest carnivores. Science 343, 1241484 (2014). - PubMed
-
- Rands M. R. W., Adams W. M., Bennun L., Butchart S. H., Clements A., Coomes D., Entwistle A., Hodge I., Kapos V., Scharlemann J. P. W., Sutherland W. J., Vira B., Biodiversity conservation: Challenges beyond 2010. Science 329, 1298–1303 (2010). - PubMed
-
- Butchart S. H., Walpole M., Collen B., Van Strien A., Scharlemann J. P. W., Almond R. E. A., Baillie J. E., Bomhard B., Brown C., Bruno J., Carpenter K. E., Carr G. M., Chanson J., Chenery A. M., Csirke J., Davidson N. C., Dentener F., Foster M., Galli A., Galloway J. N., Genovesi P., Gregory R. D., Hockings M., Kapos V., Lamarque J. F., Leverington F., Loh J., McGeoch M. A., McRae L., Minasyan A., Hernández Morcillo M., Oldfield T. E. E., Pauly D., Quader S., Revenga C., Sauer J. R., Skolnik B., Spear D., Stanwell-Smith D., Stuart S. N., Symes A., Tierney M., Tyrrell T. D., Vié J.-C., Watson R., Global biodiversity: Indicators of recent declines. Science 328, 1164–1168 (2010). - PubMed
Publication types
MeSH terms
LinkOut - more resources
Full Text Sources
Other Literature Sources

