. 2017 Dec;16(6):1342-1352.
doi: 10.1111/acel.12681. Epub 2017 Sep 25.

Sexually divergent DNA methylation patterns with hippocampal aging

Affiliations

Sexually divergent DNA methylation patterns with hippocampal aging

Dustin R Masser et al. Aging Cell. 2017 Dec.

Abstract

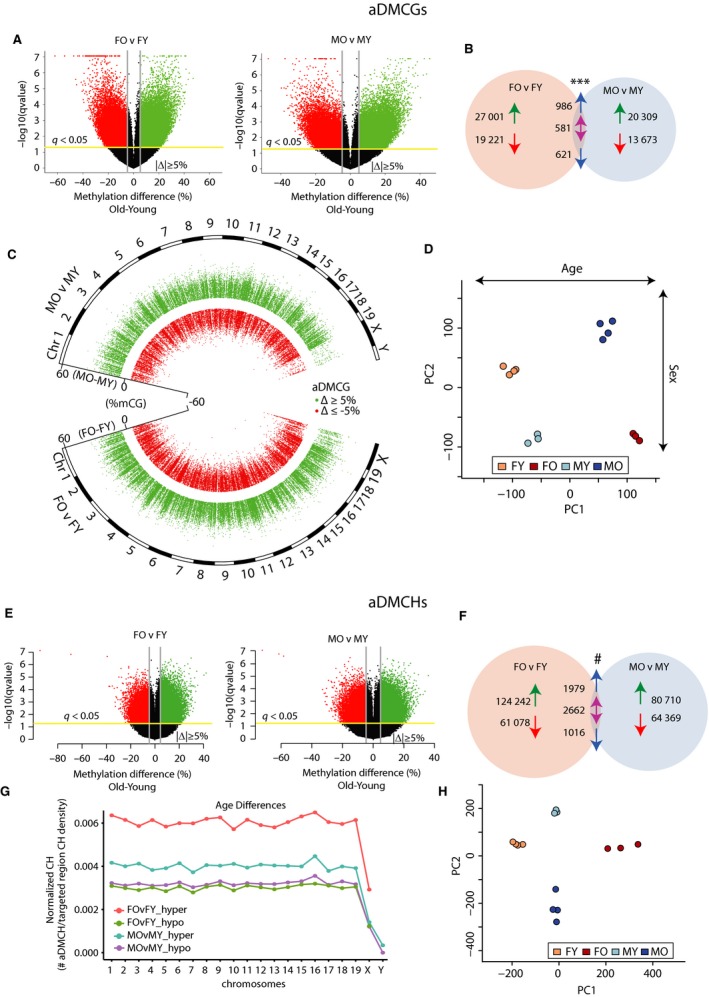
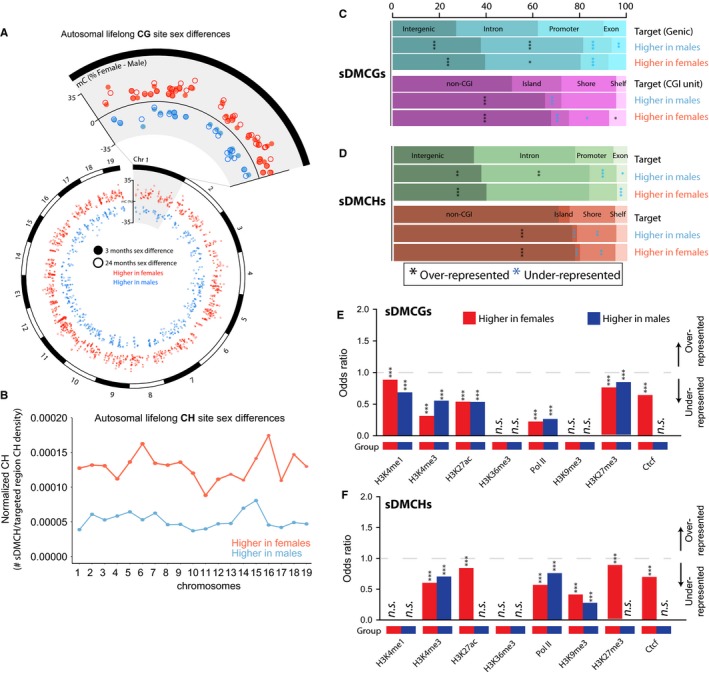
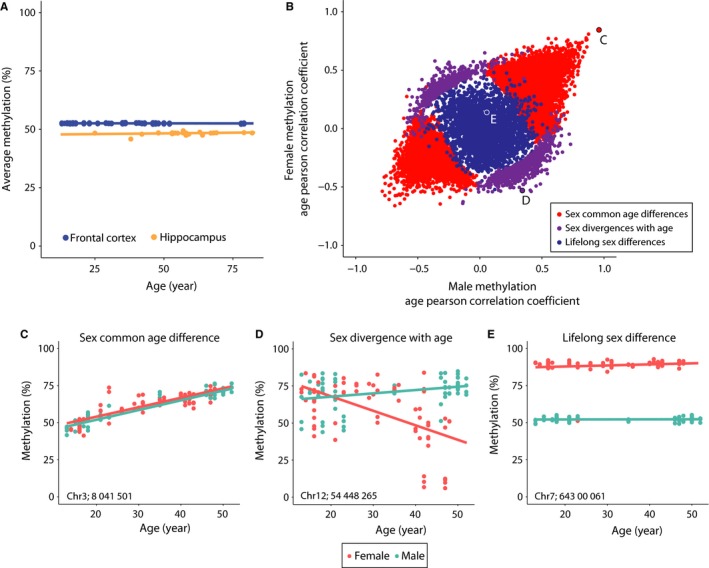
DNA methylation is a central regulator of genome function, and altered methylation patterns are indicative of biological aging and mortality. Age-related cellular, biochemical, and molecular changes in the hippocampus lead to cognitive impairments and greater vulnerability to neurodegenerative disease that varies between the sexes. The role of hippocampal epigenomic changes with aging in these processes is unknown as no genome-wide analyses of age-related methylation changes have considered the factor of sex in a controlled animal model. High-depth, genome-wide bisulfite sequencing of young (3 month) and old (24 month) male and female mouse hippocampus revealed that while total genomic methylation amounts did not change with aging, specific sites in CG and non-CG (CH) contexts demonstrated age-related increases or decreases in methylation that were predominantly sexually divergent. Differential methylation with age for both CG and CH sites was enriched in intergenic and intronic regions and under-represented in promoters, CG islands, and specific enhancer regions in both sexes, suggesting that certain genomic elements are especially labile with aging, even if the exact genomic loci altered are predominantly sex-specific. Lifelong sex differences in autosomal methylation at CG and CH sites were also observed. The lack of genome-wide hypomethylation, sexually divergent aging response, and autosomal sex differences at CG sites was confirmed in human data. These data reveal sex as a previously unappreciated central factor of hippocampal epigenomic changes with aging. In total, these data demonstrate an intricate regulation of DNA methylation with aging by sex, cytosine context, genomic location, and methylation level.

Keywords: DNA methylation; aging; divergence; epigenetics; hippocampus; sex differences.


Figures

Figure 1
Figure 1
Age‐related differentially methylated CGs (aDMCG) and CHs (aDMCGH) in male and female hippocampus. A) Volcano plots of pairwise comparisons of age‐related CG sites methylation changes in females (Female Old – FO vs. Female Young FY) and males (Male Old – MO vs. Male Young MY). Sites with false discovery‐corrected p‐value (q < 0.05) and an absolute magnitude change Old‐Young > |5%| were called differentially methylated. Sites with an age‐related increased methylation are represented in green and those with decreased methylation in red. B) Comparing the aDMCGs in males and females, more sites were found in common between the sexes than would be expected by chance (***, P < 2.6E‐106), but the majority of aDMCGs were sex‐specific. Arrows represent increased or decreased methylation with age, and in the intersection, blue arrows represent common regulation between the sexes, and the double purple arrow represents different direction of change in the sexes with age. C) aDMCGs are presented by chromosomal location in males (top) and females (bottom) and the difference in mean methylation (Old‐Young) on the inner axis. Each point represents one aDMCG meeting false discovery rate (FDR) cutoff of q < 0.05. Sites ≥ 5% absolute change in methylation with age (hypermethylated) are in green, while in red are sites ≤ −5% change in methylation with age (hypomethylated). D) The union of sites from B were used in a principle component analysis of the samples. Samples cluster by group and separated by age in the 1st component and by sex in the 2nd component. E) aDMCHs were compared in the same manner for differences in methylation with age in females and males. F) More sex‐common aDMCHs were observed than expected by chance (#, P < 01E‐200), but the majority of aDMCHs were specific to one sex or the other. Arrows as in B. G) Distribution of CH sites across the chromosomes examined by comparing the number of aDMCHs per the number of CHs in the covered regions of that chromosome. Equal representation of aDMCHs across the autosomes was observed with a lower rate of aDMCHs in the sex chromosomes. H) Taking the union of the sites in F, principle component analysis of the samples demonstrated tight clusters of samples by sex and age.
Figure 2
Figure 2
Annotation enrichment patterns of age‐related differentially methylated CG sites. A) Sex‐common and sex‐specific aDMCG distributions were examined for enrichment in relation to the CG distribution in the CGI unit regions analyzed (target). aDMCGs were separated by whether they decreased or increased in methylation with aging or if they were antagonistically differentially methylated sex‐common sites (hypermethylated with aging in one sex and hypomethylated in the other sex). Over‐representation of non‐CGI regions and under‐representation of Islands was observed for all comparisons. B) Similarly, genic regions were examined, and aDMCGs were found to be over‐represented in intergenic and intronic regions while under‐represented in promoter regions. (***P < 0.001, **P < .01, *P < 0.05 χ2 analysis, coloring by over‐representation, black or under‐representation, blue.) C) Odds ratios demonstrating enrichment of sex‐common aging differentially methylated CG sites (aDMCGs) for ENCODE and regulatory elements (activation – H3K4me1, H3K4me3, H3K27ac, H3K36me3, PolII and repression – H3K9me3, H3K27me3, Ctcf) by GenomeRunner analysis. Enrichment comparisons were carried out for hypermethylated aDMCGs (light green), hypomethylated aDMCGs (yellow), and antagonistic (dark green) sex‐common aDMCGs. Odds Ratios greater than 1.0 (gray dotted line) demonstrate over‐represented while those less than 1.0 are under‐represented. Significant enrichment or depletion is denoted by stars where *P < 0.05, **P < 0.01, and ***P < 0.001. D) Odds ratios for sex‐specific aDMCGs enrichment for ENCODE and regulatory elements. Enrichment comparisons were carried out in each sex for hypermethylated aDMCGs (dark red – females, dark blue – males) and hypomethylated aDMCGs (light red – females, light blue – males). Odds ratios greater than 1.0 (gray dotted line) are over‐represented while those less than 1.0 are under‐represented. Significant enrichment or depletion is denoted by stars where *P < 0.05, **P < 0.01, and ***P < 0.001.
Figure 3
Figure 3
Annotation enrichment patterns of age‐related differentially methylated CH sites. A) aDMCH distributions for males and females in the CGI unit regions analyzed (target) demonstrated over‐representation in non‐CGI regions and under‐representation in CGI shores and islands themselves (with one exception). In many cases, CGI shelves were over‐represented for aDMCHs. B) In genic regions, aDMCHs were found to be over‐represented in intergenic and under‐represented in promoter and exonic regions. For a number of groups, especially hypomethylation, introns were over‐represented as well. (***P < 0.001, **P < .01, *P < 0.05 χ2 analysis, coloring by over‐representation, black or under‐representation, blue.) C) Odds ratios of sex‐common aDMCHs for ENCODE and regulatory elements by GenomeRunner analysis. Enrichment comparisons were carried out for hypermethylated aDMCHs (light green), hypomethylated aDMCHs (yellow), and antagonistic (dark green) sex‐common aDMCHs. Odds ratios greater than 1.0 (gray dotted line) are over‐represented while those less than 1.0 are under‐represented. Significant enrichment or depletion is denoted by stars where *P < 0.05, **P < 0.01, and ***P < 0.001. D) Odds ratios of sex‐specific aDMCHs enrichment for ENCODE and regulatory elements. Enrichment comparisons were carried out by sex for hypermethylated aDMCHs (dark red – females, dark blue – males) and hypomethylated aDMCHs (light red – females, light blue – males). Odds ratios greater than 1.0 (gray dotted line) are over‐represented while those less than 1.0 are under‐represented. Significant enrichment or depletion is denoted by stars where *P < 0.05, **P < 0.01, and ***P < 0.001.
Figure 4
Figure 4
Lifelong sex differences in autosomal DNA methylation. A) Autosomal locations of the 901 lifelong CG site sex differences (sDMCGs) with higher methylation levels in females (orange) and sites that have higher methylation in males (blue). Closed circles represent the methylation difference between sexes in young (3 months) mice, while open circles represent the methylation difference between sexes in old (24 months) mice. For clarity, chromosome one is enlarged to visualize the lifelong nature of these autosomal sex differences. B) Autosomal distribution of lifelong CH site sex differences (sDMCHs) for the 3 028 CH sites that have either higher methylation levels in females (orange) or higher methylation in males (blue) relative to the CH density of the region examined. C) sDMCG and D) sDMCH site enrichment profiles among Genic (top) and CGI unit (bottom) regions for sites with higher methylation levels in males or in females. Percentages of sDMCGs and sDMCHs in each region type are presented in Figs. 2 and 3 (***P < 0.001, **P < .01, *P < 0.05 χ2 analysis, coloring by over‐representation, black or under‐representation, blue). E) Odds ratios of sDMCG and F) sDMCH enrichment in ENCODE and regulatory elements by GenomeRunner analysis. Odds ratios greater than 1.0 (gray dotted line) are over‐represented while those less than 1.0 are under‐represented. Significant enrichment or depletion is denoted by stars where * P < 0.05, **P < 0.01, and ***P < 0.001.
Figure 5
Figure 5
Methylation changes with aging and sex differences in the human central nervous system (CNS). A) Publicly available human methylation data from hippocampus and frontal cortex demonstrate no change in mean CG methylation with age. B) Using the fontal cortex data, for which there is a larger samples size and equal distribution between sexes, a general linear model was used to determine individual sites with significant age, sex, or interaction effects on methylation level. Plotted by Pearson's correlation coefficients to age by females (y‐axis) and males (x‐axis), sites with sex‐common age‐related decreases in methylation (red, bottom left) and increases in methylation (red, top left) are evident. Sites with sexually divergent response to aging (significant interaction effect) are in purple. Lifelong sex differences are plotted in blue. Sites without any significant factor of age or sex are not shown to improve clarity. C) Example site of a sex‐common age‐related differentially methylated site. D) Example of sexually divergent response to aging. E) Example of lifelong sex difference. Locations of specific sites are given and are also highlighted in panel B.

References

    1. Ashapkin VV, Kutueva LI, Vanyushin BF (2015) Aging epigenetics: accumulation of errors or realization of a specific program? Biochemistry (Mosc) 80, 1406–1417. - PubMed
    1. Bell CG, Xia Y, Yuan W, Gao F, Ward K, Roos L, Mangino M, Hysi PG, Bell J, Wang J, Spector TD (2016) Novel regional age‐associated DNA methylation changes within human common disease‐associated loci. Genome Biol. 17, 193. - PMC - PubMed
    1. Chen T, Dent SY (2014) Chromatin modifiers and remodellers: regulators of cellular differentiation. Nat. Rev. Genet. 15, 93–106. - PMC - PubMed
    1. Chow HM, Herrup K (2015) Genomic integrity and the ageing brain. Nat. Rev. Neurosci. 16, 672–684. - PubMed
    1. Cole JJ, Robertson NA, Rather MI, Thomson JP, McBryan T, Sproul D, Wang T, Brock C, Clark W, Ideker T, Meehan RR, Miller RA, Brown‐Borg HM, Adams PD (2017) Diverse interventions that extend mouse lifespan suppress shared age‐associated epigenetic changes at critical gene regulatory regions. Genome Biol. 18, 58. - PMC - PubMed

Publication types