. 2018 Mar;23(3):735-746.
doi: 10.1038/mp.2017.185. Epub 2017 Sep 26.

Stem cell-derived neurons from autistic individuals with SHANK3 mutation show morphogenetic abnormalities during early development

Affiliations

Stem cell-derived neurons from autistic individuals with SHANK3 mutation show morphogenetic abnormalities during early development

A Kathuria et al. Mol Psychiatry. 2018 Mar.

Abstract

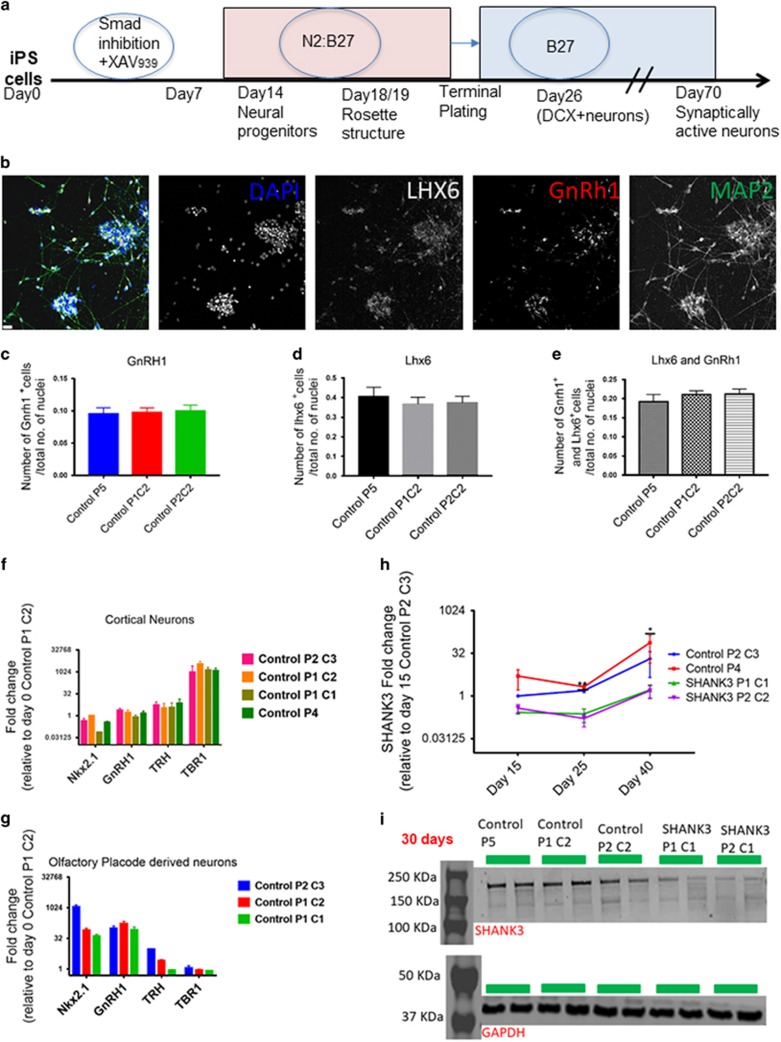
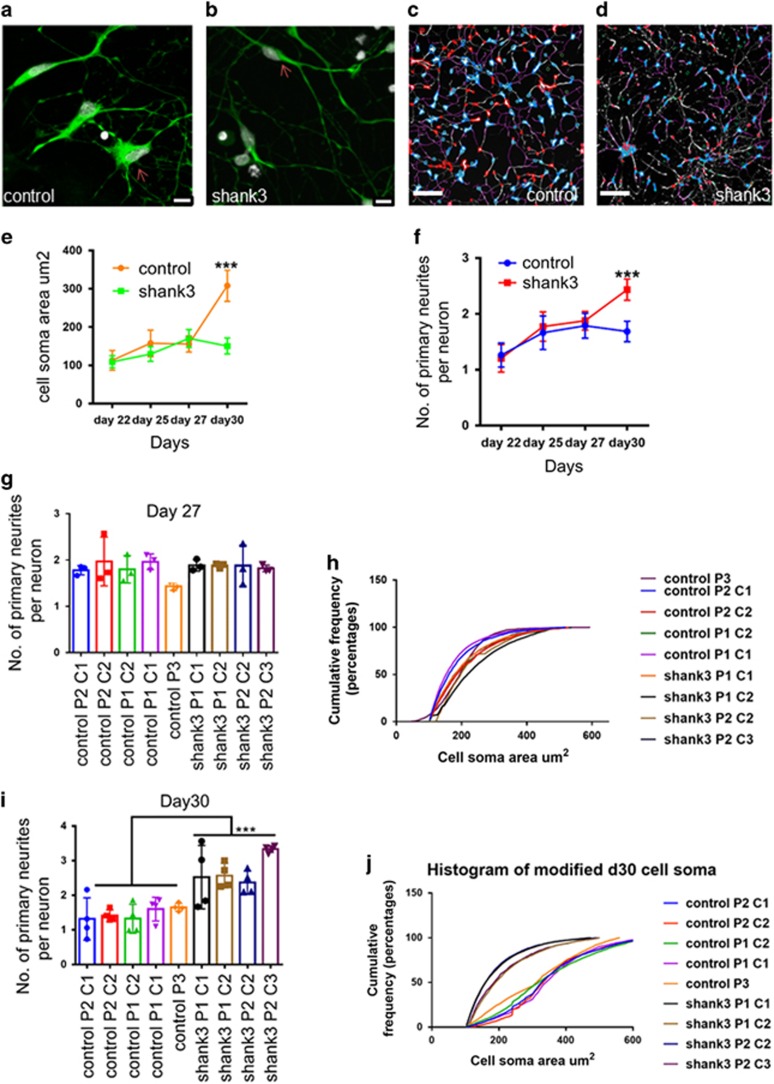
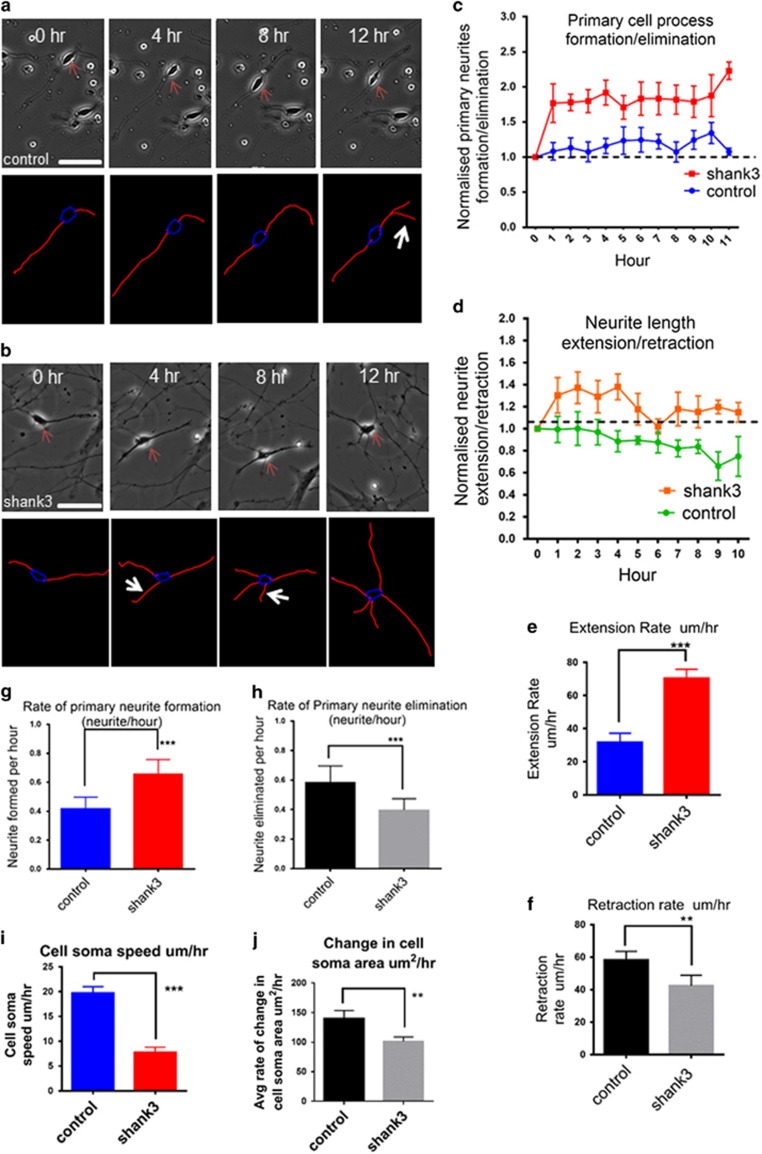
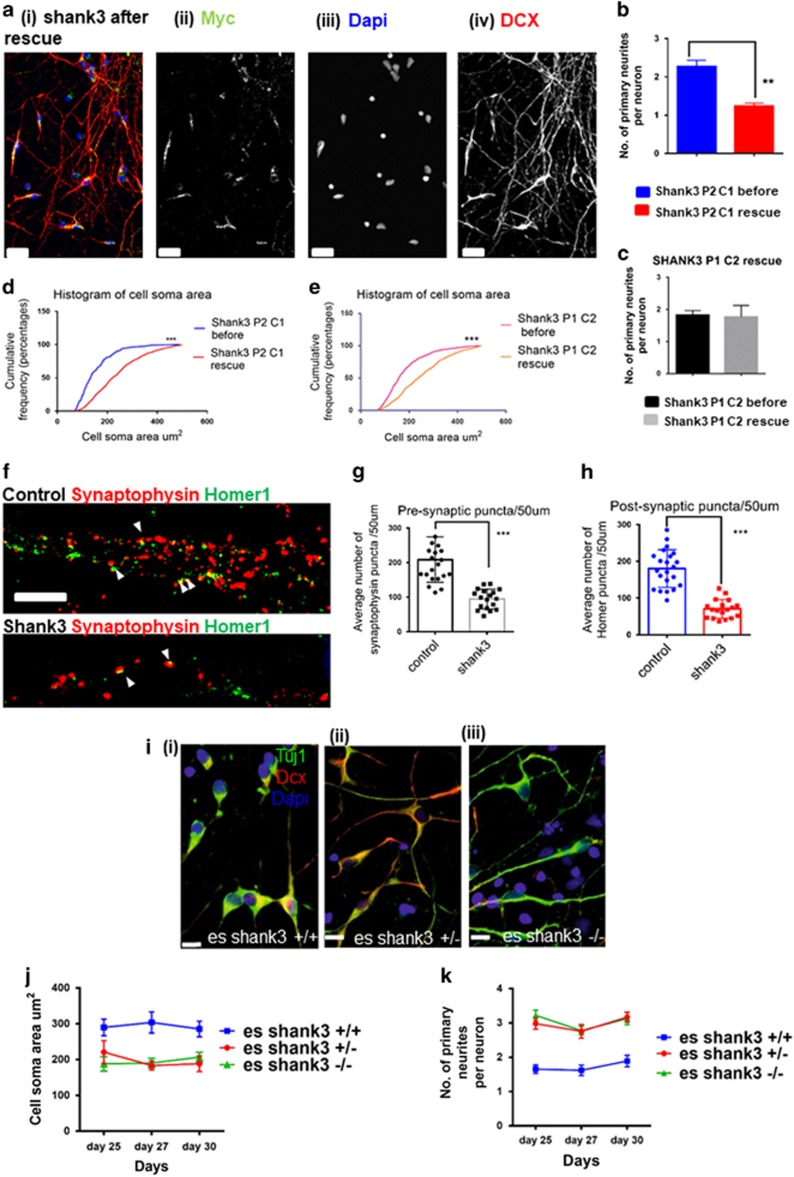
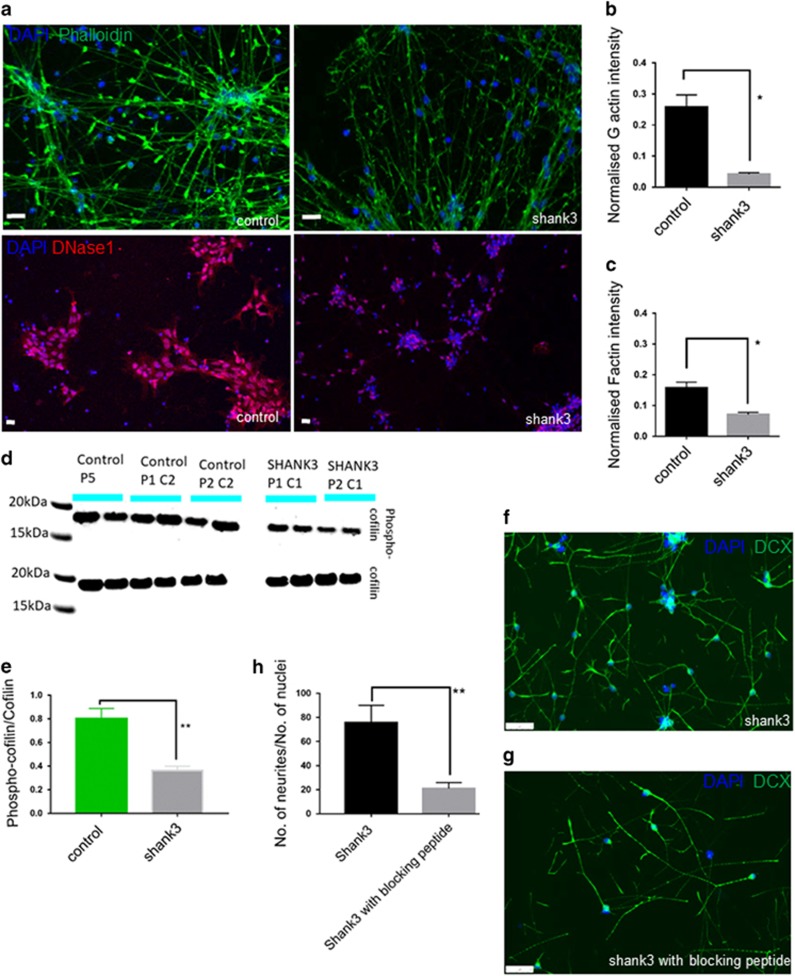
Shank3 is a structural protein found predominantly at the postsynaptic density. Mutations in the SHANK3 gene have been associated with risk for autism spectrum disorder (ASD). We generated induced pluripotent stem cells (iPSCs) from control individuals and from human donors with ASD carrying microdeletions of SHANK3. In addition, we used Zinc finger nucleases to generate isogenic SHANK3 knockout human embryonic stem (ES) cell lines. We differentiated pluripotent cells into either cortical or olfactory placodal neurons. We show that patient-derived placodal neurons make fewer synapses than control cells. Moreover, patient-derived cells display a developmental phenotype: young postmitotic neurons have smaller cell bodies, more extensively branched neurites, and reduced motility compared with controls. These phenotypes were mimicked by SHANK3-edited ES cells and rescued by transduction with a Shank3 expression construct. This developmental phenotype is not observed in the same iPSC lines differentiated into cortical neurons. Therefore, we suggest that SHANK3 has a critical role in neuronal morphogenesis in placodal neurons and that early defects are associated with ASD-associated mutations.


Conflict of interest statement

The authors declare no conflict of interest.

Figures

Figure 1
Figure 1
Neuralization (a). The chart depicts the neuralization protocol used and indicates the five stages of neuralization. These are the induced pluripotent stem (iPS) cell (day 0), the neural progenitors (day 12), the rosette structure (day 18/19), the doublecortin positive neurons (day 26) and the synaptically active neuronal stage (day 70). (b) Day 30 placodal control neurons positive for Lhx6, GnRH1, MAP2, DAPI (4,6-diamidino-2-phenylindole) and negative for CTIP2 (scale=25 μm). (c) Number of GnRH1-positive cells/total no. of nuclei. (d) Number of Lhx6-positive cells/total no.of nuclei. (e) Number of both Lhx6- and GnRH1-positive cells/total no. of nuclei. (f) Cortical gene expression for control cortical neurons at day 30 of neuralization. (g) Olfactory placodal gene expression for control placodal neurons at day 28 of neuralization. Both graphs show fold change relative to day 0 control P1 C2, assessed via quantitative PCR (qPCR). (h) SHANK3 fold change for control and SHANK3 neurons at days 15, 25 and 40 of neuralization, relative to Control P2 C3 at day 15, assessed via qPCR. Data are expressed as mean±s.e.m. (i) Western blotting of SHANK3 at day 30, normalized to glyceraldehyde 3-phosphate dehydrogenase (GAPDH). Three control lines were compared with 2 SHANK3 lines with two biological replicates, Control P1 C2 stands for Control patient 1 clone, Control P2 C2 stands for Control patient 2 clone 2, Control P5 is control patient 5 and SHANK3 P1 C1 is SHANK3 patient 1 clone1 and SHANK3 P2 C1 is SHANK3 patient 2 clone 1.
Figure 2
Figure 2
Morphological deficits found in immature SHANK3 patient neurons. (a) Control neurons cell soma. (b) SHANK3 neurons cell soma (scale=10 μm, day 30 neurons stained with DCX (doublecortin; green) and DAPI (4,6-diamidino-2-phenylindole; gray)). (c and d) Bare images of Control and SHANK3 DCX+ neurons at day 30 taken during high-content screening, scale=200 μm. (e) High-content screening performed to find changes in cell soma area μm2 from day 22 (late neural progenitors) to day 30 (immature neurons). Data are represented as mean±s.e.m., Mann–Whitney U-test was performed for each time point; the only difference was seen at day 30. ***P<0.001. (f) High-content screening performed to find out the number of primary neurites per neuron from day 22 (late neural progenitors) to day 30 (immature neurons). Data are represented as mean±s.e.m. Unpaired Student’s t-test with Welch’s correction was performed for each time point; the only difference was seen at day 30. ***P<0.001. (g and i) The number of primary neurites per neuron at days 27 and 30. Data are represented as mean±s.d., ***P<0.001, Student’s t-test was performed, Control neurons n=26.0 × 10³; shank3 neurons n=30.0 × 10³. (h and j) Cumulative frequency distribution of cell soma area at days 27 and 30. (***P<0.001, Kolmogorov–Smirnov test was performed, Control neurons n=26.0 × 10³; shank3 neurons n=30.0 × 10³). We performed three biological replicates. We compared five control lines with four SHANK3 lines, three control lines with two clonal replicates and two SHANK3 lines with one clonal replicate of each.
Figure 3
Figure 3
SHANK3 patient neurons exhibit abnormal neurite outgrowth. (a) Phase-contrast image of control neuron and tracing (red: neurite, blue: cell body outline, yellow: secondary branches) neuron at zero hour, fourth hour, eighth hour and twelfth hour. (b) Phase-contrast image of SHANK3 neuron and tracing given below at zero hour, fourth hour, eighth hour and twelfth hour (scale=50 μm), the arrows represent the neurites formed every hour. (c) Primary neurite of formation/elimination rate were normalized to zero hour; >1 represents the formation, <1 represents elimination. Data are presented as mean±s.e.m. (Two-way analysis of variance (ANOVA) performed, ***P<0.001 b/w genotypes, ***P<0.001 b/w genotypes and days). (d) Neurite extension/retraction rate of primary neurite were normalized to zero hour; >1 represents the extension, <1 represents retraction. Data are presented as mean±s.e.m. (***P<0.001, two-way ANOVA performed). (e) Extension rate (μm h−1). (f) Retraction rate (μm h−1). (g) Formation rate (neurite h−1). (h) Elimination rate (neurite h−1). Data are represented as mean±s.d., ***P<0.001, **P<0.001, ***P<0.001, ***P<0.001 for panels (eh), respectively. Unpaired Student’s t-test with Welch’s correction was performed. (i) Cell soma speed (μm h−1). (j) Change in cell soma area μm2 h−1. Data are represented as mean±s.d. ***P<0.001 and **P=0.005 for panels (i) and (j), respectively, unpaired Student’s t-test with Welch’s correction was performed. Control neurons n=51; SHANK3 neurons n=59, from all three biological replicates. We compared four control lines with four SHANK3 lines, two control lines with one clonal replicate of each and two SHANK3 lines with one clonal replicate of each.
Figure 4
Figure 4
Overexpression of SHANK3 rescues morphogenetic deficits in immature SHANK3 patient neurons: (a) Day 30 SHANK3 neuron after rescue (i), DCX (doublecortin; red) (iv), MYC (green) stained (ii), DAPI (4,6-diamidino-2-phenylindole; blue) (iii), (scale=25 μm). (b) Number of primary neurites per neuron SHANK3 Patient 2 clone 1 with and without rescue. (c) Number of primary neurites per neuron SHANK3 Patient 1 clone 2 with and without rescue. Data are represented as mean±s.e.m. Data compared via unpaired Student’s t-test with Welch’s correction. (**P=0.0026 SHANK3 P2 C1 before vs SHANK3 P2 C1 rescue, **P=0.0066 SHANK3 P2 C1 before vs SHANK3 P2 C1 rescue-18). (d) Cumulative frequency distribution of cell soma area (μm2) of SHANK3 Patient 2 clone 1 with and without rescue. (e) Cumulative frequency distribution of cell soma area (μm2) of SHANK3 Patient 1 clone 2 with and without rescue. Data compared via Kolmogorov–Smirnov test. (***P<0.001 SHANK3 P2 C1 before vs SHANK3 P2 C1 rescue, ***P<0.001 SHANK3 P2 C1 before vs SHANK3 P2 C1 rescue-18, ***P<0.001 SHANK3 P1 C2 before vs SHANK3 P1 C2 rescue and ***P<0.001 SHANK3 P1 C2 before vs SHANK3 P1 C2 rescue-18). SHANK3 P2 C1 before n=331, SHANK3 P2 C1 with rescue n=749, SHANK3 P2 C1 with rescue -18 n=557, SHANK3 P1 C2 before n=689, SHANK3 P1 C2 with rescue n=662, SHANK3 P1 C2 with rescue-18 n=839 from all three biological replicates. (f) Day 70 control neurons stained with Homer1 (postsynaptic marker) and Synaptophysin (presynaptic marker). Day 70 SHANK3 neuron stained with Homer1 (postsynaptic marker) and Synaptophysin (presynaptic marker) (scale=10 μm), arrows represent the co-localization of pre and post synaptic markers. (g) The average number of Synpatophysin puncta per 50 μm. (h) The average number of Homer1 puncta per 50 μm. Significant differences in expression of both Synaptophysin and Homer1 were found. ***P<0.001 (unpaired Student’s t-test with Welch’s correction). Data are expressed as mean±s.e.m. We compared two control lines with two SHANK3 lines (control neurons n=46; SHANK3 neurons n=41, from three biological replicates). (i) (i–iii) day 30 es shank3 +/+, es shank3 +/− and es shank3−/−-derived neurons stained with DAPI, DCX and Tuj1 (scale bar=10 μm). (j) Cell soma area changes through various neuralization stages (days 25–30). Data are represented as mean±s.e.m. Freidman’s two-way analysis of variance (ANOVA) by ranks pairwise comparison ***P<0.001 on all three stages of neuralization. (k) The change in the number of primary neurites (days 25–30). Data are presented as mean±s.e.m., (es shank3 shank3+/+ n=5.1 × 10³, es shank3+/− n=5.0 × 10³, es shank3−/− n=5.11 × 10³ from all three biological replicates). Two-way ANOVA with repeated measure performed at each time point, ***P<0.001: significant difference was found between genotypes and **P<0.005: there is an interaction between days and genotypes. Bonferroni’s multiple comparisons test revealed ***P<0.001 es shank3 +/+ vs es shank3+/−, ***P<0.001 es shank3+/+ vs es shank3−/− and P=1.0 es shank3+/− and es shank3−/−.
Figure 5
Figure 5
SHANK3 patient neurons show reduced F and G actin. (a) Phalloidin (green, F actin) and DnaseI (red, G actin) staining of control and SHANK3 patient neurons (Scale=20 μm). (b and c) Normalized (G and F) actin intensity. Data are presented as mean±s.e.m., *P=0.029 and *P=0.0275 for panels (b) and (c), respectively, unpaired Student’s t-test with Welch’s correction was performed. (d and e) Western blotting of Phospho-Cofilin/total Cofilin. Data are presented as mean±s.e.m., **P=0.0025, unpaired Student’s t-test with Welch’s correction was performed. (f and g). SHANK3 neurons at day 30/31 before and after addition of cofilin blocking peptide (scale=50 μm). Data are presented as mean±s.e.m., **P=0.0032, unpaired Student’s t-test with Welch’s correction was performed.

Similar articles

Cited by

References

    1. Hallmayer J, Cleveland S, Torres A, Phillips J, Cohen B, Torigoe T et al. Genetic heritability and shared environmental factors among twin pairs with autism. Arch Gen Psychiatry 2011; 68: 1095–1102. - PMC - PubMed
    1. Betancur C. Etiological heterogeneity in autism spectrum disorders: more than 100 genetic and genomic disorders and still counting. Brain Res 2011; 1380: 42–77. - PubMed
    1. LaFlamme B. Genetic modules for autism. Nat Genet 2015; 47: 105–105.
    1. Bourgeron T. A synaptic trek to autism. Curr Opin Neurobiol 2009; 19: 231–234. - PubMed
    1. Boeckers TM, Bockmann J, Kreutz MR, Gundelfinger ED. ProSAP/Shank proteins—a family of higher order organizing molecules of the postsynaptic density with an emerging role in human neurological disease. J Neurochem 2002; 81: 903–910. - PubMed

Publication types

MeSH terms

Substances