

Levels of Cognitive Control: A Functional Magnetic Resonance Imaging-Based Test of an RDoC Domain Across Bipolar Disorder and Schizophrenia
- PMID: 28948978
- PMCID: PMC5770769
- DOI: 10.1038/npp.2017.233
Levels of Cognitive Control: A Functional Magnetic Resonance Imaging-Based Test of an RDoC Domain Across Bipolar Disorder and Schizophrenia
Abstract
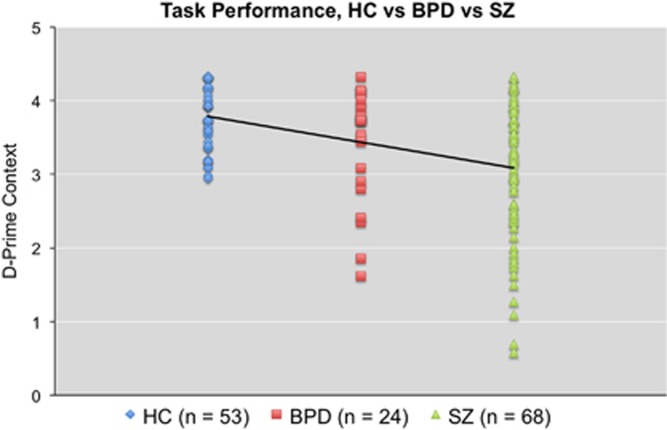
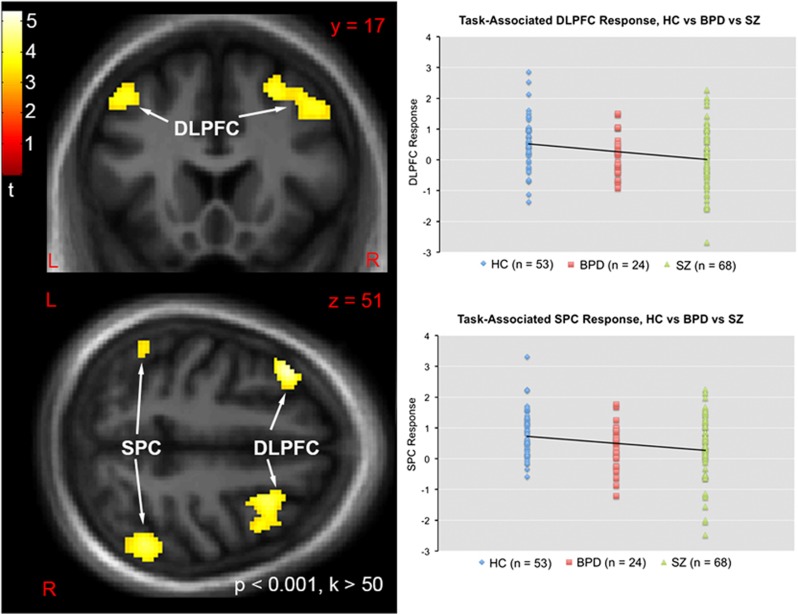
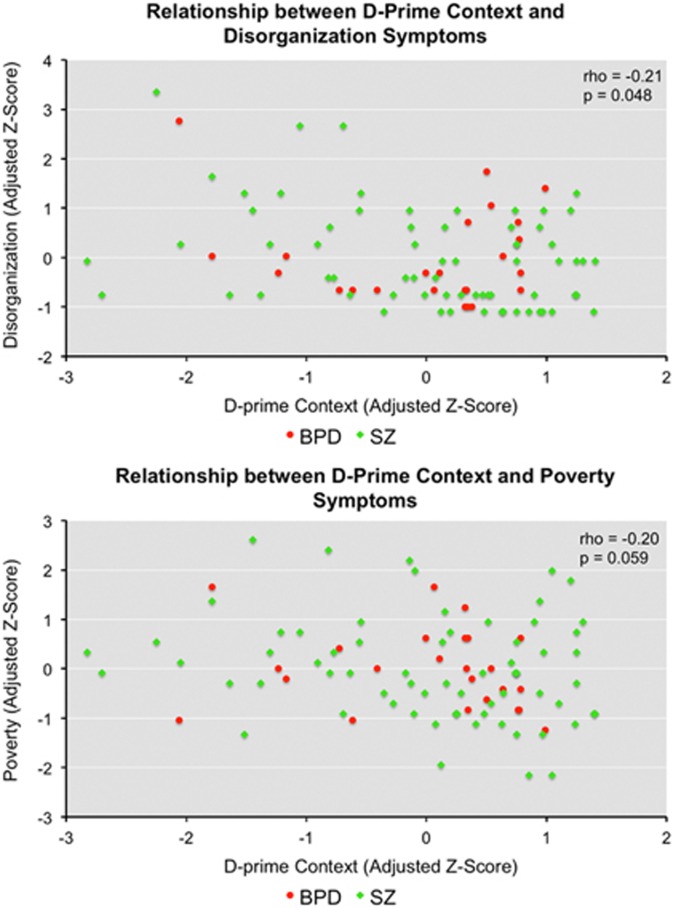
In recent years, the boundaries of psychopathology as defined by diagnostic categories have been criticized as inadequately 'carving nature at its joints' with respect to the neurobiology of major mental disorders. In 2010 the NIMH launched the Research Domain Criteria (RDoC) framework for understanding mental illnesses as brain circuit disorders that extend beyond DSM-defined diagnoses. In the present study we focus on cognitive dysfunction, a core feature of schizophrenia (SZ) and bipolar disorder (BPD), and use functional magnetic resonance imaging (fMRI) during a cognitive control (CC) task in recent onset patients to test the hypothesis that at a behavioral and underlying neural circuitry level these deficits exist on a continuum (as opposed to showing categorical differences) across the two disorders. In total, 53 healthy controls, 24 recent (<1 y) onset patients with BPD Type I with psychotic features, and 70 recent onset patients with SZ performed the AX-Continuous Performance Task while undergoing event-related fMRI at 1.5 T. In addition to behavior task-associated response was examined in frontoparietal regions-of-interest. In an a priori contrast-based analysis, significant deficits across patient groups (vs controls) were observed on CC-associated performance as well as frontoparietal response. These analyses further revealed a continuum of deficits in which BPD showed intermediate levels of CC relative to controls and SZ. Poor CC was associated with poverty and disorganization symptoms across patient groups. These results support the hypothesis that CC dysfunction in BPD and SZ reflects a continuum of deficits that cuts across traditional, DSM-based classification. Implications for the neurobiology of these diseases are discussed.
Figures
Similar articles
-
Neural complexity as a potential translational biomarker for psychosis.J Affect Disord. 2017 Jul;216:89-99. doi: 10.1016/j.jad.2016.10.016. Epub 2016 Oct 26. J Affect Disord. 2017. PMID: 27814962 Free PMC article.
-
Transdiagnostic Prediction of Affective, Cognitive, and Social Function Through Brain Reward Anticipation in Schizophrenia, Bipolar Disorder, Major Depression, and Autism Spectrum Diagnoses.Schizophr Bull. 2020 Apr 10;46(3):592-602. doi: 10.1093/schbul/sbz075. Schizophr Bull. 2020. PMID: 31586408 Free PMC article.
-
Brain activity and connectivity in response to negative affective stimuli: Impact of dysphoric mood and sex across diagnoses.Hum Brain Mapp. 2016 Nov;37(11):3733-3744. doi: 10.1002/hbm.23271. Hum Brain Mapp. 2016. PMID: 27246897 Free PMC article.
-
Meta-analysis of functional magnetic resonance imaging studies of timing and cognitive control in schizophrenia and bipolar disorder: Evidence of a primary time deficit.Schizophr Res. 2017 Oct;188:21-32. doi: 10.1016/j.schres.2017.01.039. Epub 2017 Feb 4. Schizophr Res. 2017. PMID: 28169089 Review.
-
Shared and distinct brain fMRI response during performance of working memory tasks in adult patients with schizophrenia and major depressive disorder.Hum Brain Mapp. 2021 Nov;42(16):5458-5476. doi: 10.1002/hbm.25618. Epub 2021 Aug 25. Hum Brain Mapp. 2021. PMID: 34431584 Free PMC article. Review.
Cited by
-
Comparing machine and deep learning-based algorithms for prediction of clinical improvement in psychosis with functional magnetic resonance imaging.Hum Brain Mapp. 2021 Mar;42(4):1197-1205. doi: 10.1002/hbm.25286. Epub 2020 Nov 13. Hum Brain Mapp. 2021. PMID: 33185307 Free PMC article.
-
Differing functional mechanisms underlie cognitive control deficits in psychotic spectrum disorders.J Psychiatry Neurosci. 2020 Nov 1;45(6):430-440. doi: 10.1503/jpn.190212. J Psychiatry Neurosci. 2020. PMID: 32869961 Free PMC article.
-
The Transdiagnostic Connectome Project: an open dataset for studying brain-behavior relationships in psychiatry.Sci Data. 2025 Jun 2;12(1):923. doi: 10.1038/s41597-025-04895-z. Sci Data. 2025. PMID: 40456751 Free PMC article.
-
Comparing the functional neuroanatomy of proactive and reactive control between patients with schizophrenia and healthy controls.Cogn Affect Behav Neurosci. 2023 Feb;23(1):203-215. doi: 10.3758/s13415-022-01036-6. Epub 2022 Nov 23. Cogn Affect Behav Neurosci. 2023. PMID: 36418846 Free PMC article.
-
Baseline Frontoparietal Task-Related BOLD Activity as a Predictor of Improvement in Clinical Symptoms at 1-Year Follow-Up in Recent-Onset Psychosis.Am J Psychiatry. 2019 Oct 1;176(10):839-845. doi: 10.1176/appi.ajp.2019.18101126. Epub 2019 Jul 1. Am J Psychiatry. 2019. PMID: 31256610 Free PMC article.
References
-
- American Psychiatric Association (1997). Practice guideline for the treatment of patients with schizophrenia. Am J Psychiatry 154(4 Suppl): S1–S63. - PubMed
-
- Andreasen NC (1984. a) Scale for the Assessment of Negative Symptoms (SANS). Department of Psychiatry, College of Medicine, The University of Iowa: Iowa City, IA.
-
- Andreasen NC (1984. b) Scale for the Assessment of Positive Symptoms (SAPS). Department of Psychiatry, College of Medicine, the University of Iowa: Iowa City, IA.
-
- Arndt S, Andreasen NC, Flaum M, Miller D, Nopoulos P (1995). A longitudinal study of symptom dimensions in schizophrenia. Prediction and patterns of change. Arch Gen Psychiatry 52: 352–360. - PubMed
MeSH terms
Grants and funding
LinkOut - more resources
Full Text Sources
Other Literature Sources
Medical
