. 2017 Nov 15;595(22):6869-6885.
doi: 10.1113/JP275052. Epub 2017 Oct 25.

Calcium influx through TRPV4 channels modulates the adherens contacts between retinal microvascular endothelial cells

Affiliations

Calcium influx through TRPV4 channels modulates the adherens contacts between retinal microvascular endothelial cells

Tam T T Phuong et al. J Physiol. .

Abstract

Key points: Endothelial cells employ transient receptor potential isoform 4 (TRPV4) channels to sense ambient mechanical and chemical stimuli. In retinal microvascular endothelial cells, TRPV4 channels regulate calcium homeostasis, cytoskeletal signalling and the organization of adherens junctional contacts. Intracellular calcium increases induced by TRPV4 agonists include a significant contribution from calcium release from internal stores. Activation of TRPV4 channels regulates retinal endothelial barriers in vitro and in vivo. TRPV4 sensing may provide a feedback mechanism between sensing shear flow and eicosanoid modulators, vascular permeability and contractility at the inner retinal endothelial barrier.

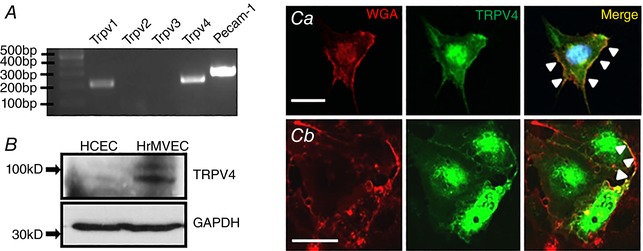
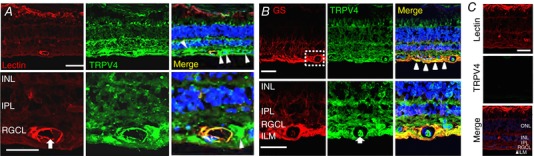
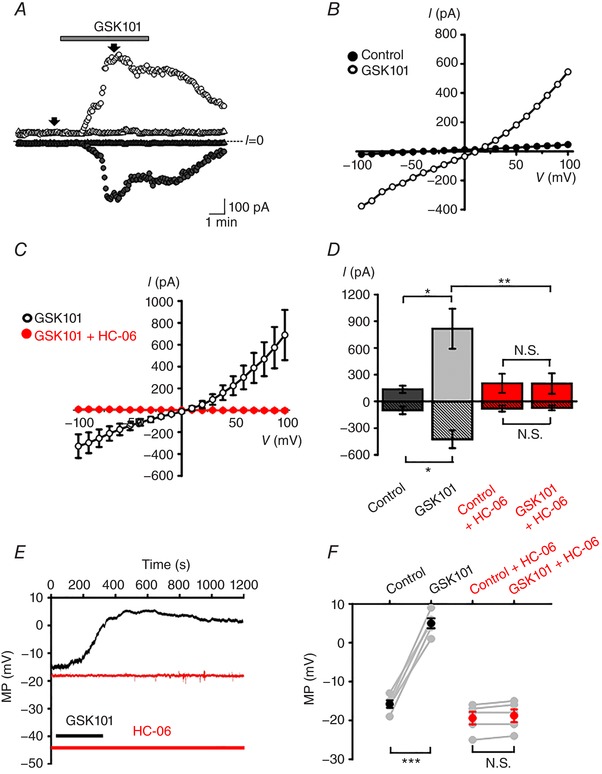
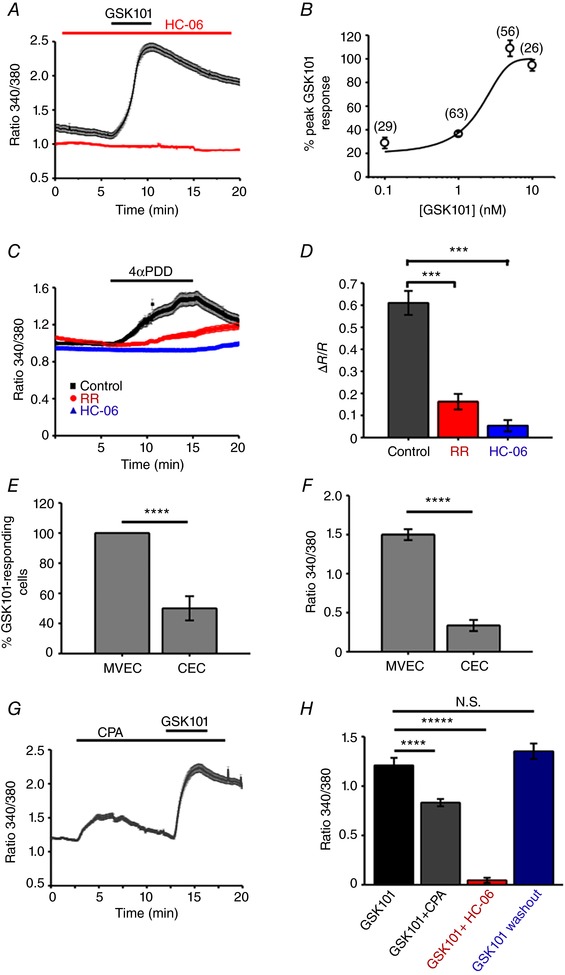
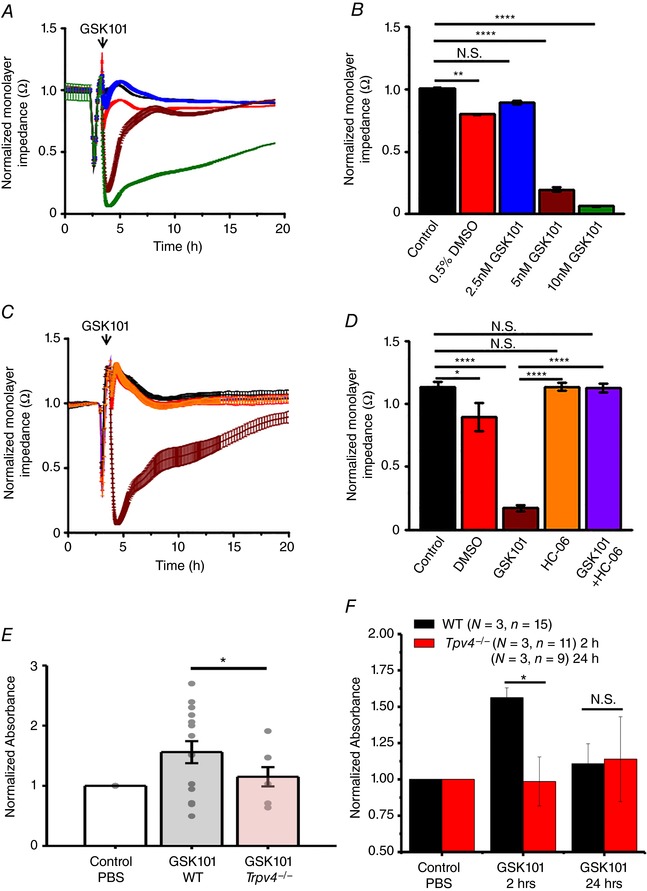
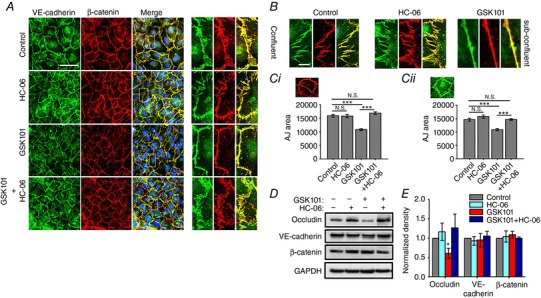
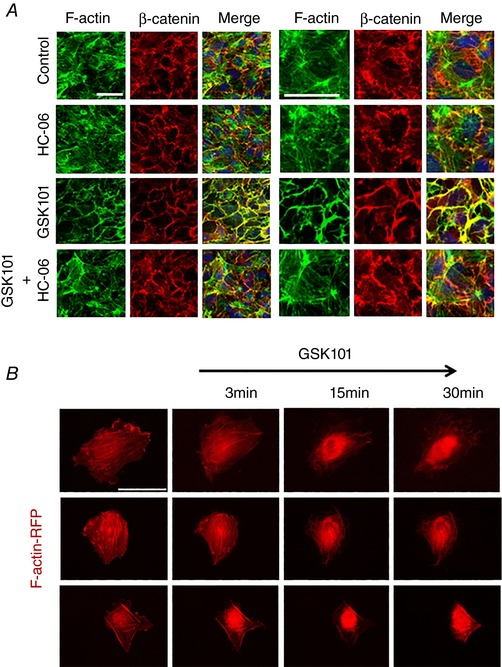
Abstract: The identity of microvascular endothelial (MVE) mechanosensors that sense blood flow in response to mechanical and chemical stimuli and regulate vascular permeability in the retina is unknown. Using immunohistochemistry, calcium imaging, electrophysiology, impedance measurements and vascular permeability assays, we show that the transient receptor potential isoform 4 (TRPV4) plays a major role in Ca2+ /cation signalling, cytoskeletal remodelling and barrier function in retinal microvasculature in vitro and in vivo. Human retinal MVE cells (HrMVECs) predominantly expressed Trpv1 and Trpv4 transcripts, and TRPV4 was broadly localized to the plasma membrane of cultured cells and intact blood vessels in the inner retina. Treatment with the selective TRPV4 agonist GSK1016790A (GSK101) activated a nonselective cation current, robustly elevated [Ca2+ ]i and reversibly increased the permeability of MVEC monolayers. This was associated with disrupted organization of endothelial F-actin, downregulated expression of occludin and remodelling of adherens contacts consisting of vascular endothelial cadherin (VE-cadherin) and β-catenin. In vivo, GSK101 increased the permeability of retinal blood vessels in wild type but not in TRPV4 knockout mice. Agonist-evoked effects on barrier permeability and cytoskeletal reorganization were antagonized by the selective TRPV4 blocker HC 067047. Human choroidal endothelial cells expressed lower TRPV4 mRNA/protein levels and showed less pronounced agonist-evoked calcium signals compared to MVECs. These findings indicate a major role for TRPV4 in Ca2+ homeostasis and barrier function in human retinal capillaries and suggest that TRPV4 may differentially contribute to the inner vs. outer blood-retinal barrier function.

Keywords: TRPV4; adherens junctions; calcium; retinal microvascular endothelial cells; vascular permeability.


Figures

Figure 1
Figure 1. TRPV4 is expressed in retinal microvascular cells
A, RT‐PCR. Trpv1, Trpv4 and Pecam‐1 but not Trpv2 & 3 transcripts are expressed in HrMVECs. B, Western blot. TRPV4 protein expression is prominent in HrMVECs but weak in HCECs. C, HrMVEC labelled by anti‐TRPV4 antibody and a plasma membrane marker (WGA; wheat germ agglutinin) (Ca). The TRPV4 signal within the plasmalemma is marked by arrowheads. Transfection with the Trpv4:eGfp construct (Cb). While TRPV4 expression is predominantly cytosolic, the TRPV4‐ir signal colocalizes with WGA at the plasma membrane (arrowheads). Scale bar = 50 μm. [Color figure can be viewed at wileyonlinelibrary.com]
Figure 2
Figure 2. Vertical section from the human retina
A, TRPV4 colocalizes with blood vessel marker tomato lectin (TL). The lumen of the blood vessel is marked by the arrow. Putative RGCs are labelled by arrowheads. Scale bar = 20 μm. B, double labelling for TRPV4 and glutamine synthetase (GS); the two proteins colocalize in Müller end‐feet (arrowheads) and MVECs (arrow). Scale bar = 50 μm. C, TRPV4‐ir is reduced in retinas pre‐incubated with a blocking antibody. Scale bar = 20 μm. ILM, inner limiting membrane; RGCL, retinal ganglion cell layer; IPL, inner plexiform layer; INK, inner nuclear layer. [Color figure can be viewed at wileyonlinelibrary.com]
Figure 3
Figure 3. TRPV4 is functionally expressed in HrMVECs, and associated with non‐selective cation conductance
A, voltage clamp. Representative time courses of whole cell currents in control (circles) and HC‐06 (5 μm)‐treated (triangles) cells held at −100 mV (filled symbols) and +100 mV (open symbols). HC‐06 was applied 3 min prior to the stimulation with GSK101 (3 nm). Arrows indicate time points where the current amplitude values were taken for analysis. B, conductances evoked by ramping the holding potential from −100 to +100 mV. The I–V relationship for the cell shown in A was generated by subtracting controls from GSK101‐evoked responses. C, averaged I–V curves from control (black trace, n = 10 cells) and HC‐06‐treated (red trace, n = 10) cells. D, summary of amplitude values derived from I–V curves at −100 mV (stippled bars) and 100 mV (open bars). Shown are the mean ± SEM values. * P < 0.05; ** P < 0.01; N.S. P > 0.05; paired t test. E, current clamp. Representative membrane potential (MP) responses to GSK101 in control untreated (black) and HC‐06 treated (red) cells. F, summary for the depolarizing effect of GSK101 on the membrane potential (MP) in control (*** P < 0.001, paired t test, n = 5 cells) and HC‐06‐treated (N.S., P > 0.05, paired t test, n = 5) cells. [Color figure can be viewed at wileyonlinelibrary.com]
Figure 4
Figure 4. TRPV4 activation elevates [Ca2+]i in HrMVECs
A, 340/380 Fura‐2 ratio signals. GSK101 (1 nm) elevates [Ca2+]i in a representative experiment (n = 12 MVECs), an effect that is inhibited by HC‐06 (5 μm). B, the dose–response curve for the GSC101‐induced [Ca2+]i increases. Shown in parentheses are the numbers of studied cells. C, Ruthenium Red (RR) and HC‐06 inhibit 4α‐PDD‐mediated rise in [Ca2+]i. ±SEM show the inter‐cell variability at each time point in this representative experiment. D, summary of RR and HC‐06 effects on 4α‐PDD‐induced [Ca2+]i elevations. Mean ± SEM. *** P < 0.001, n = 102, n = 61 and n = 53 cells for control, RR and HC‐06, respectively; paired t test. E, a subset of HCECs responded to GSK101 (25 nm); the number of CEC responders (37.5 ± 10%) is markedly lower compared to HrMVECs responders (∼100%) to a much lower (1 nm) GSK101 concentration (P < 0.001). F, peak amplitude GSK101‐evoked ΔR/R [Ca2+]i signals in HrMVECs are significantly larger than in HCECs (P < 0.001). G, 340/380 ratio. CPA (10 μm) elevates [Ca2+]i and reduces the absolute amplitude of GSK101‐evoked [Ca2+]i elevations. H, ΔR/R responses. Summary of the fluorescence measurements in cells stimulated with GSK101, GSK101 + CPA and GSK101 + HC‐06 (N ≥ 3 independent experiments per condition). [Color figure can be viewed at wileyonlinelibrary.com]
Figure 5
Figure 5. TRPV4 stimulation rapidly and dramatically decreases the impedance of HrMVEC monolayers and increases the in vivo permeability of retinal blood vessels
The ‘normalized monolayer impedance’ is derived by dividing the impedance value by the value at a reference time point. A, 2.5 nm (red), 5 nm (brown) and 10 nm (green trace) GSK101 dose‐dependently decrease the resistance of HrMVEC monolayers. B, cumulative data for the experiments shown in A (N = 3). C, HC‐06 (orange) inhibits 10 nm GSK101‐induced decreases in monolayer resistance (brown trace) (N = 3). D, averaged data from C. * P < 0.05, ** P < 0.001, **** P < 0.00001, paired t test. E, systemic injection of GSK101 increases the retinal extravasation of Evans Blue 2 h after dye injection, indicated by increased absorbance signal in WT (grey bar) compared to Trpv4−/− retinas (red bar). The dots represent individual retinas; values are normalized to control values of dye‐exposed retinas in the absence of the TRPV4 agonist. Retinal extravasation was measured 2 and 24 h after GSK101 treatment. F, cumulative data for three independent experiments from WT (black bars) and Trpv4−/− retinas measured 2 and 24 h after GSK101 treatment. * P = 0.033; N.S., P > 0.05; one‐way ANOVA. Mean ± SEM. [Color figure can be viewed at wileyonlinelibrary.com]
Figure 6
Figure 6. TRPV4 agonist triggers reorganization of cell‐cell junctions
A and B, VE‐cadherin‐ir (green) and β‐catenin‐ir (red) in confluent (A) and sub‐confluent cells (B) in the presence of GSK101, HC‐06 and GSK101/HC‐06. Merged images in A include DAPI staining (blue). Scale bar = 50 μm. The panels on the right show high‐resolution images. Scale bar = 10 μm. C, summary of the effects of TRPV4 agonist/antagonist on AJ overlap. Overlap was quantified by tracing the β‐catenin‐ir boundary (Ca) in adjacent cells. Quantification of VE‐cadherin‐ir areas (Cb). Paired t test, N = 3 independent experiments. D, western blots. Protein levels of occludin, but not VE‐cadherin and β‐catenin are lowered following exposure to GSK101 (5 nm). E, relative protein density from experiments shown in D, normalized to control, *** P < 0.0001 (N = 3 independent experiments). [Color figure can be viewed at wileyonlinelibrary.com]
Figure 7
Figure 7. TRPV4‐dependent remodelling of F‐actin and AJs in confluent HrMVECs
A, double labelling for β‐catenin and F‐actin. Combined images include DAPI staining (blue). GSK101‐induced disruption of central and cortical F‐actin was rescued by the TRPV4 antagonist (HC‐06). Scale bar = 50 μm. B, red fluorescent protein (RFP)‐actin‐transfected HrMVEC cells exposed to GSK101 (5 nm) show time‐dependent redistribution of F‐actin towards the cell nucleus. Scale bar = 50 μm. [Color figure can be viewed at wileyonlinelibrary.com]

Similar articles

Cited by

References

    1. Akazawa Y, Yuki T, Yoshida H, Sugiyama Y & Inoue S (2013). Activation of TRPV4 strengthens the tight‐junction barrier in human epidermal keratinocytes. Skin Pharmacol Physiol 26, 15–21. - PubMed
    1. Attwell D, Buchan AM, Charpak S, Lauritzen M, Macvicar BA & Newman EA (2010). Glial and neuronal control of brain blood flow. Nature 468, 232–243. - PMC - PubMed
    1. Bagher P, Beleznai T, Kansui Y, Mitchell R, Garland CJ & Dora KA (2012). Low intravascular pressure activates endothelial cell TRPV4 channels, local Ca2+ events, and I KCa channels, reducing arteriolar tone. Proc Natl Acad Sci U S A 109, 18174–18179. - PMC - PubMed
    1. Berna‐Erro A, Izquierdo‐Serra M, Sepúlveda RV, Rubio‐Moscardo F, Doñate‐Macián P, Serra SA, Carrillo‐Garcia J, Perálvarez‐Marín A, González‐Nilo F, Fernández‐Fernández JM & Valverde MA (2017). Structural determinants of 5′,6′‐epoxyeicosatrienoic acid binding to and activation of TRPV4 channel. Sci Rep 7, 10522. - PMC - PubMed
    1. Bharadwaj AS, Appukuttan B, Wilmarth PA, Pan Y, Stempel AJ, Chipps TJ, Benedetti EE, Zamora DO, Choi D, David LL & Smith JR (2013). Role of the retinal vascular endothelial cell in ocular disease. Prog Retin Eye Res 32, 102–180. - PMC - PubMed

Publication types

MeSH terms