. 2017 Oct 10;13(10):5131-5145.
doi: 10.1021/acs.jctc.7b00464. Epub 2017 Sep 26.

Iterative Molecular Dynamics-Rosetta Membrane Protein Structure Refinement Guided by Cryo-EM Densities

Affiliations

Iterative Molecular Dynamics-Rosetta Membrane Protein Structure Refinement Guided by Cryo-EM Densities

Sumudu P Leelananda et al. J Chem Theory Comput. .

Abstract

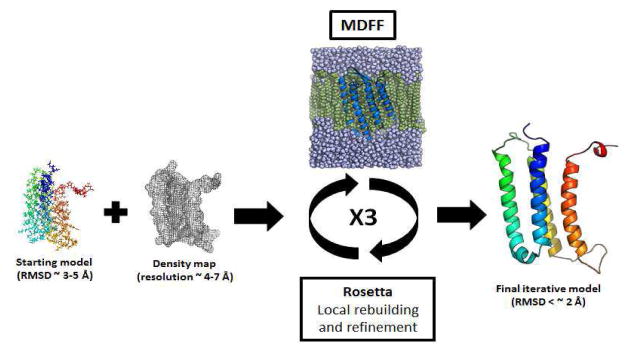
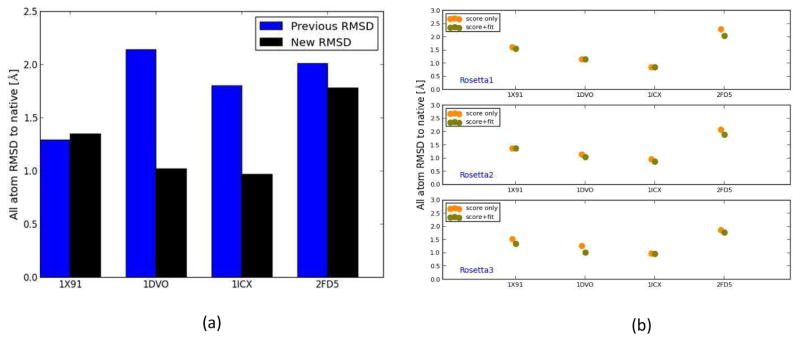
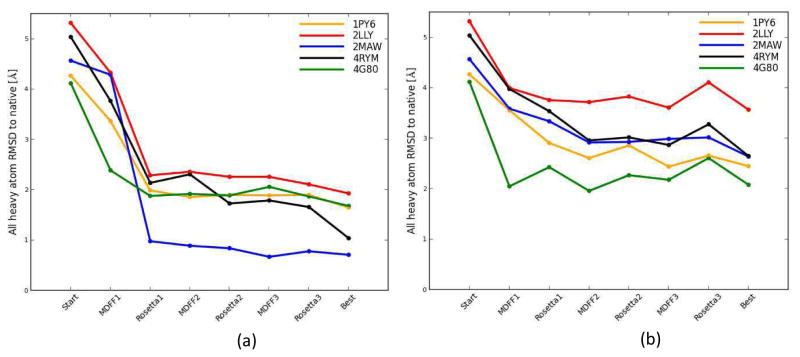
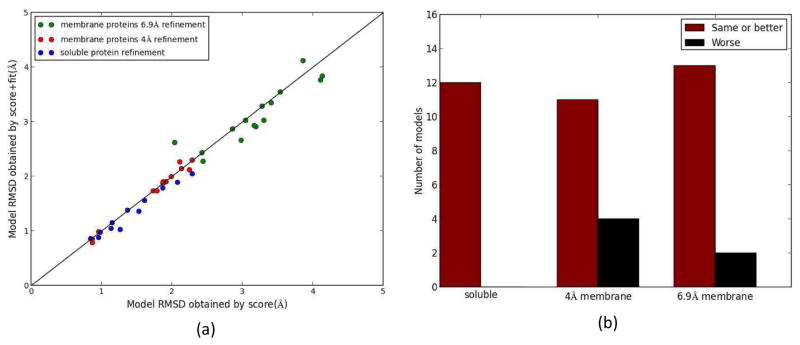
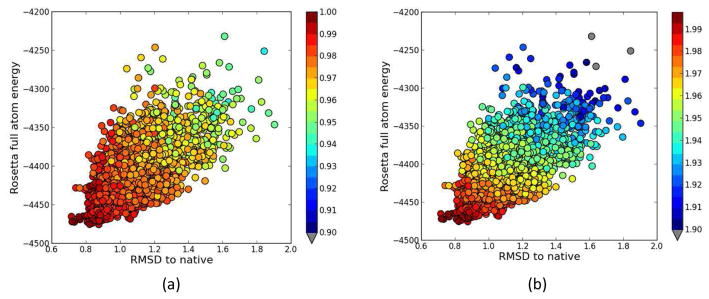
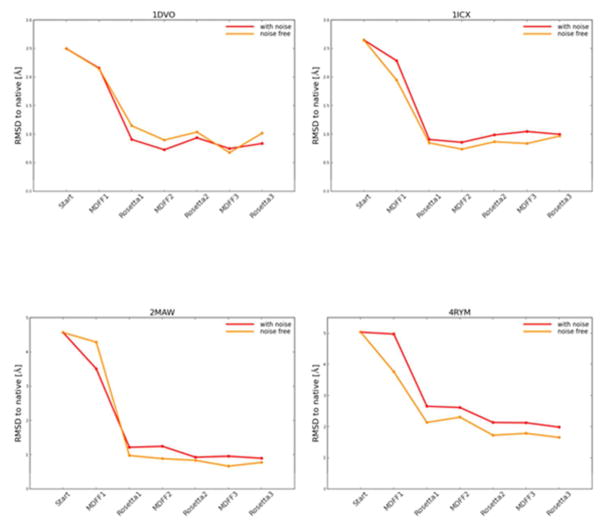
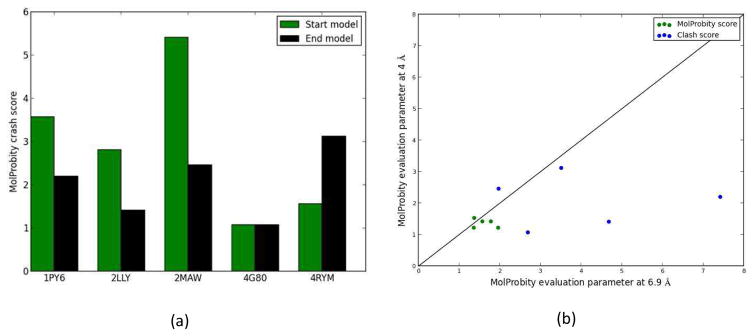
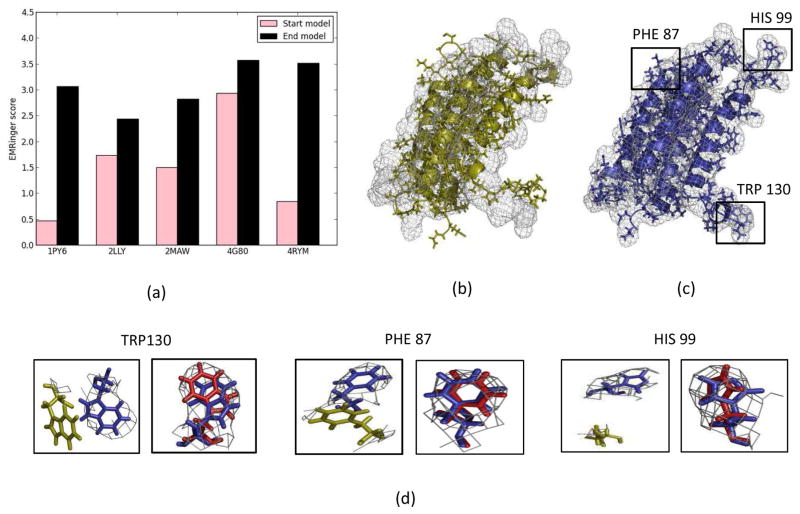
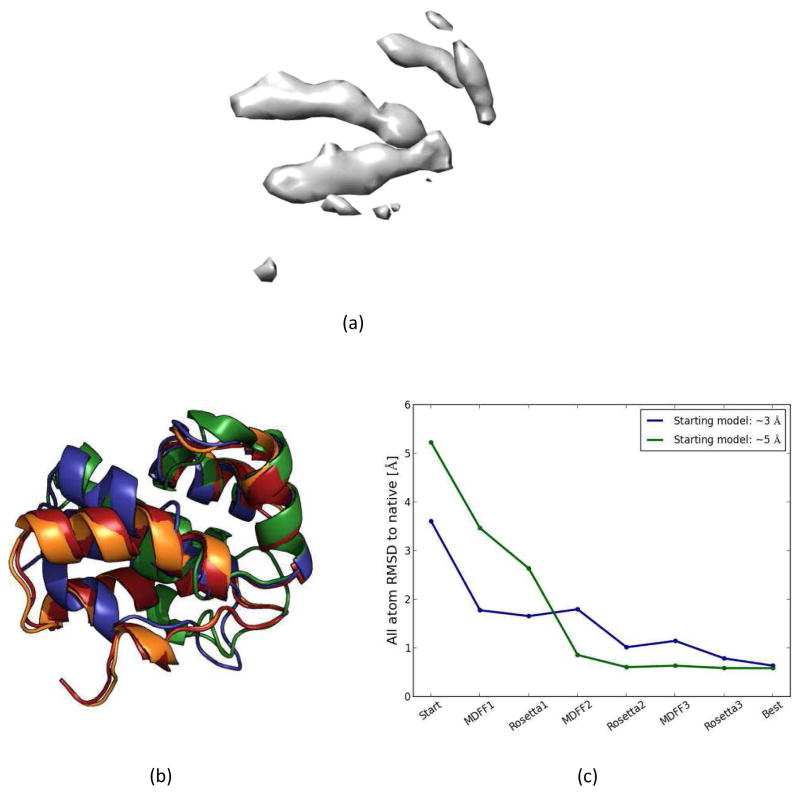
Knowing atomistic details of proteins is essential not only for the understanding of protein function but also for the development of drugs. Experimental methods such as X-ray crystallography, NMR, and cryo-electron microscopy (cryo-EM) are the preferred forms of protein structure determination and have achieved great success over the most recent decades. Computational methods may be an alternative when experimental techniques fail. However, computational methods are severely limited when it comes to predicting larger macromolecule structures with little sequence similarity to known structures. The incorporation of experimental restraints in computational methods is becoming increasingly important to more reliably predict protein structure. One such experimental input used in structure prediction and refinement is cryo-EM densities. Recent advances in cryo-EM have arguably revolutionized the field of structural biology. Our previously developed cryo-EM-guided Rosetta-MD protocol has shown great promise in the refinement of soluble protein structures. In this study, we extended cryo-EM density-guided iterative Rosetta-MD to membrane proteins. We also improved the methodology in general by picking models based on a combination of their score and fit-to-density during the Rosetta model selection. By doing so, we have been able to pick models superior to those with the previous selection based on Rosetta score only and we have been able to further improve our previously refined models of soluble proteins. The method was tested with five membrane spanning protein structures. By applying density-guided Rosetta-MD iteratively we were able to refine the predicted structures of these membrane proteins to atomic resolutions. We also showed that the resolution of the density maps determines the improvement and quality of the refined models. By incorporating high-resolution density maps (∼4 Å), we were able to more significantly improve the quality of the models than when medium-resolution maps (6.9 Å) were used. Beginning from an average starting structure root mean square deviation (RMSD) to native of 4.66 Å, our protocol was able to refine the structures to bring the average refined structure RMSD to 1.66 Å when 4 Å density maps were used. The protocol also successfully refined the HIV-1 CTD guided by an experimental 5 Å density map.


Figures

Figure 1
Figure 1
Native structures of the proteins used in this study embedded in membrane (a) 1PY6 (b) 2LLY (c) 2MAW (d) 4G80 (e) 4RYM. Water molecules are shown in purple, membrane is in green and protein structures are shown in blue.
Figure 2
Figure 2
Simulated density maps for 1PY6 at (a) 4 Å and (b) 6.9 Å.
Figure 3
Figure 3
A schematic diagram showing the iterative Rosetta-MD protocol.
Figure 4
Figure 4
(a) The RMSDs of the final refined models using iterative Rosetta-MD protocol where models were picked based on a consensus score which is a combination of the Rosetta score and the fit-to-density (black) and based on Rosetta score-only (blue). For 1DVO, 1ICX and 2FD5 the new method was able to further improve the quality of the final structures. (b) RMSD of the selected models in each Rosetta step for the soluble proteins. Orange filled circles show the RMSDs of models picked by the best score method and green filled circles show the RMSDs of models picked based on consensus score method. For 75% of the cases, the consensus score method was able to pick a better model than the score-only method.
Figure 5
Figure 5
The RMSDs of the models along the flow of the iterative Rosetta-MD protocol; 1PY6 (orange), 2LLY (red), 2MAW (blue), 4G80 (green) and 4RYM (black) (a) Refinement into 4 Å density map (b) refinement into 6.9 Å density map. RMSDs of the models for all membrane proteins generally improved throughout the three rounds of the iterative protocol. More prominent gradual decrease was observed in the case of the high-resolution 4 Å density map.
Figure 6
Figure 6
The structure alignment of the native structure (orange), the ab initio start model (blue) and the final refined model (red) for the 4 Å refinement for (a) 1PY6 (b) 2LLY (c) 2MAW (d) 4G80 (e) 4RYM.
Figure 7
Figure 7
Side chain agreement of refined models with native structures. Structure alignment of the native structure (orange) and the final refined model (red) for the 4 Å refinement for (a) 1PY6 (b) 2LLY (c) 2MAW (d) 4G80 (e) 4RYM.
Figure 8
Figure 8
(a) The RMSDs of the models that would have been picked for all Rosetta rounds using the score-only method and the consensus score method for soluble proteins (blue) and membrane protein refinement utilizing 4 Å (red) and 6.9 Å (green) density maps. (b) Histogram of occurrences that a model with lower or same RMSD was picked by the consensus score method compared to the score-only method. For soluble proteins, 4 Å membrane refinement and 6.9 Å membrane refinement the model picked was better or the same 100%, 73% and 87% of the cases respectively.
Figure 9
Figure 9
RMSD vs. Rosetta score plots for the final round Rosetta models of 2MAW. The models are color-coded by their respective (a) normalized fit-to-density and (b) consensus score (normalized score + normalized fit-to-density). The best score-only model RMSD is 0.87 Å and the model RMSD that is picked using the consensus score is 0.78 Å. With the consensus score, the model picked was better than the best score-only model.
Figure 10
Figure 10
The RMSDs of the models along the flow of the iterative Rosetta-MD protocol for noise-free density maps and noise-containing density maps (a) 1DVO (b) 1ICX (c) 2MAW (d) 4RYM. The addition of noise did not change the extent of refinement of the models.
Figure 11
Figure 11
Model evaluation using MolProbity. (a) The MolProbity clash score for the models refined by 4 Å resolution density maps (black) and the MolProbity clash score of their starting ab initio models (green) (b) MolProbity score (green) and the MolProbity clash score (blue) of final models obtained by the 4 Å and 6.9 Å maps.
Figure 12
Figure 12
(a) EMRinger score for the ab initio start models (pink) and the models after three rounds of iterative Rosetta-MD refinement using 4 Å density maps (black) (b) ab initio start structure of 2LLY (yellow) overlapped with the 4 Å density map (black mesh). Side chain mismatches and deviation from the densities can been seen. (c) The final refined 2LLY model (blue) overlapped with the 4 Å density map (black mesh). Three residues with benzene rings, PHE 87, HIS 99 and TRP 130, were misaligned with the density map in the ab initio start model but were well converged into the density map in the final refined model (highlighted in black boxes). (d) Zoomed in side chain residue overlaps; the native coordinates (red), the ab initio starting model coordinates (yellow) and the final refined model coordinates (blue). Side chains were well aligned with the density and overlapped with the native side chain coordinates in the refined model.
Figure 13
Figure 13
(a) 5 Å resolution density map of HIV-1 CTD (b) HIV-1 CTD structure; the native structure is shown in orange, two ab initio models (RMSDs ~3 Å, 5 Å) are shown in blue and green, the final refined structure is in red. (c) The variation of RMSDs for the two ab initio HIV-1 CTD models along the flow of the iterative Rosetta-MD protocol.

Similar articles

Cited by

References

    1. Alberts B, Johnson A, Lewis J, Raff M, Roberts K, Walter P. The shape and structure of proteins. 2002
    1. Jacobson M, Sali A. Comparative protein structure modeling and its applications to drug discovery. Annual reports in medicinal chemistry. 2004;39:259–276.
    1. Almén MS, Nordström KJV, Fredriksson R, Schiöth HB. Mapping the human membrane proteome: a majority of the human membrane proteins can be classified according to function and evolutionary origin. BMC Biology. 2009;7:50–50. - PMC - PubMed
    1. Elokely K, Velisetty P, Delemotte L, Palovcak E, Klein ML, Rohacs T, Carnevale V. Understanding TRPV1 activation by ligands: Insights from the binding modes of capsaicin and resiniferatoxin. Proceedings of the National Academy of Sciences. 2016;113(2):E137–E145. - PMC - PubMed
    1. Bae C, Anselmi C, Kalia J, Jara-Oseguera A, Schwieters CD, Krepkiy D, Won Lee C, Kim EH, Kim JI, Faraldo-Gómez JD, Swartz KJ. Structural insights into the mechanism of activation of the TRPV1 channel by a membrane-bound tarantula toxin. elife. 2016;5:e11273. - PMC - PubMed

MeSH terms

Substances

LinkOut - more resources