

Infectious reactivation of cytomegalovirus explaining age- and sex-specific patterns of seroprevalence
- PMID: 28949962
- PMCID: PMC5630159
- DOI: 10.1371/journal.pcbi.1005719
Infectious reactivation of cytomegalovirus explaining age- and sex-specific patterns of seroprevalence
Erratum in
-
Correction: Infectious reactivation of cytomegalovirus explaining age- and sex-specific patterns of seroprevalence.PLoS Comput Biol. 2019 Jun 12;15(6):e1007146. doi: 10.1371/journal.pcbi.1007146. eCollection 2019 Jun. PLoS Comput Biol. 2019. PMID: 31188817 Free PMC article.
Abstract
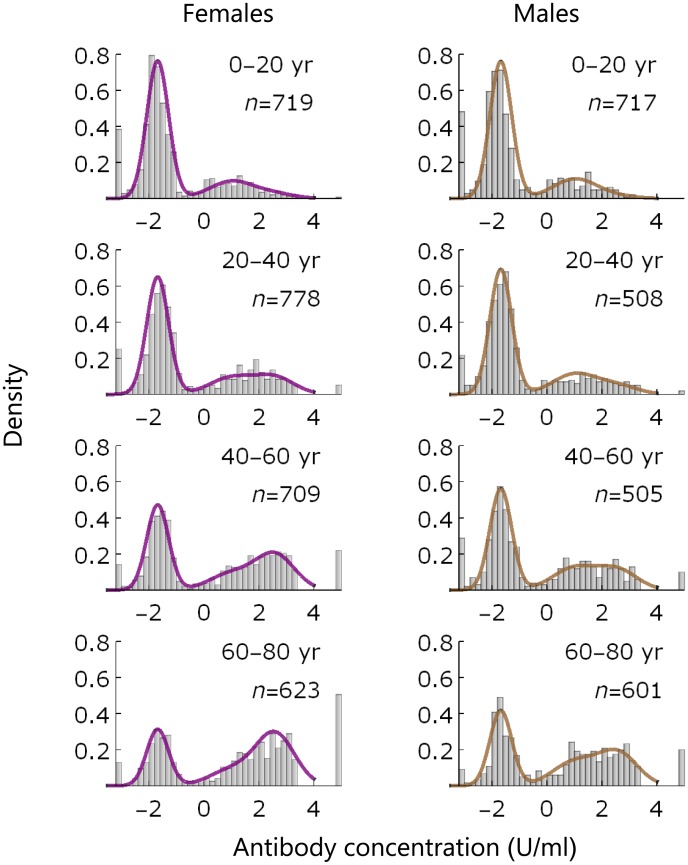
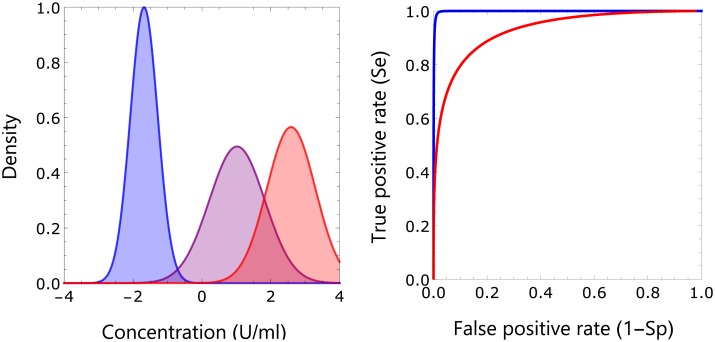
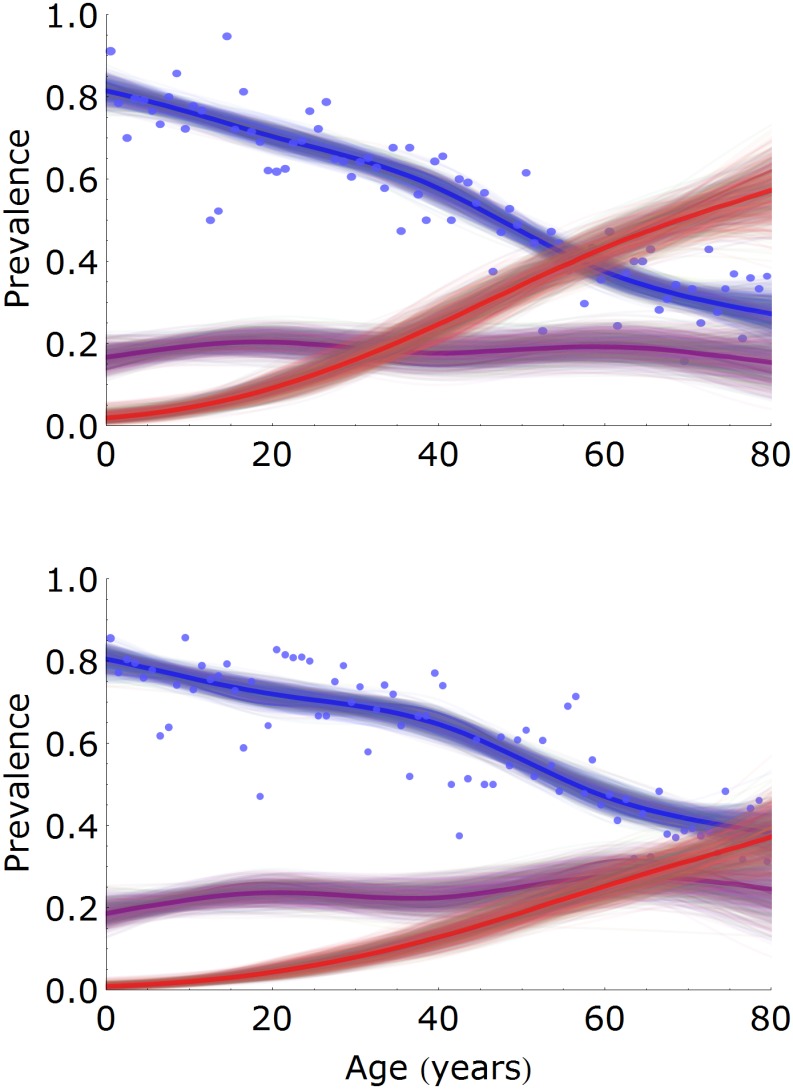
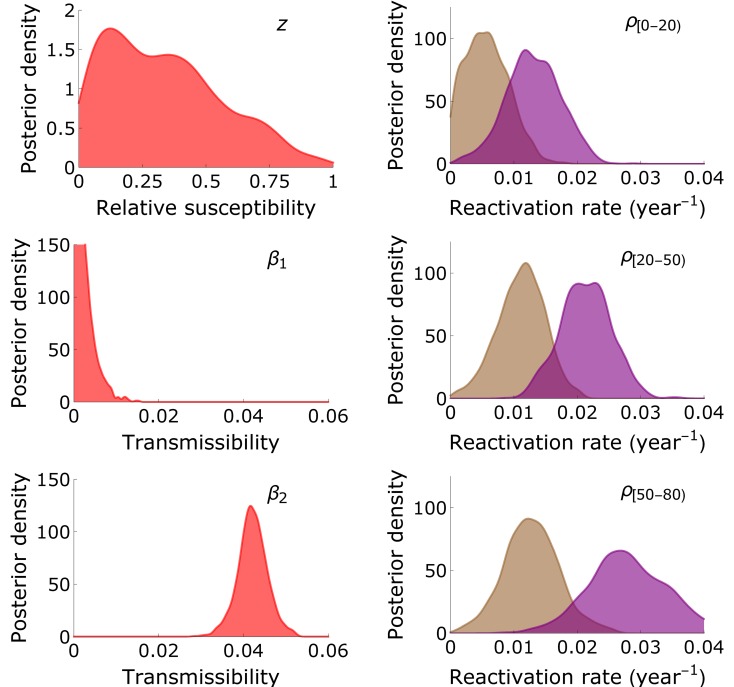
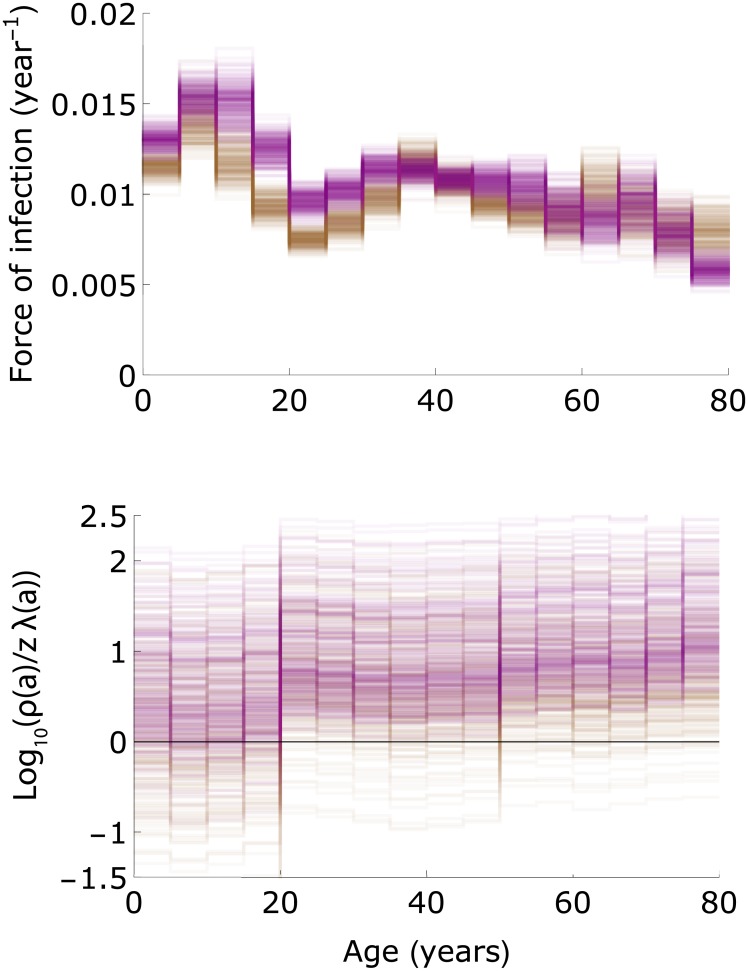
Human cytomegalovirus (CMV) is a herpes virus with poorly understood transmission dynamics. Person-to-person transmission is thought to occur primarily through transfer of saliva or urine, but no quantitative estimates are available for the contribution of different infection routes. Using data from a large population-based serological study (n = 5,179), we provide quantitative estimates of key epidemiological parameters, including the transmissibility of primary infection, reactivation, and re-infection. Mixture models are fitted to age- and sex-specific antibody response data from the Netherlands, showing that the data can be described by a model with three distributions of antibody measurements, i.e. uninfected, infected, and infected with increased antibody concentration. Estimates of seroprevalence increase gradually with age, such that at 80 years 73% (95%CrI: 64%-78%) of females and 62% (95%CrI: 55%-68%) of males are infected, while 57% (95%CrI: 47%-67%) of females and 37% (95%CrI: 28%-46%) of males have increased antibody concentration. Merging the statistical analyses with transmission models, we find that models with infectious reactivation (i.e. reactivation that can lead to the virus being transmitted to a novel host) fit the data significantly better than models without infectious reactivation. Estimated reactivation rates increase from low values in children to 2%-4% per year in women older than 50 years. The results advance a hypothesis in which transmission from adults after infectious reactivation is a key driver of transmission. We discuss the implications for control strategies aimed at reducing CMV infection in vulnerable groups.
Conflict of interest statement
The authors have declared that no competing interests exist.
Figures

Similar articles
-
A dynamic transmission model with age-dependent infectiousness and reactivation for cytomegalovirus in the United States: Potential impact of vaccination strategies on congenital infection.Hum Vaccin Immunother. 2015;11(7):1788-802. doi: 10.1080/21645515.2015.1016665. Hum Vaccin Immunother. 2015. PMID: 25984886 Free PMC article.
-
Seroepidemiology of cytomegalovirus infections in Croatia.Wien Klin Wochenschr. 2017 Feb;129(3-4):129-135. doi: 10.1007/s00508-016-1069-7. Epub 2016 Sep 6. Wien Klin Wochenschr. 2017. PMID: 27599701
-
Seroprevalences of varicella-zoster virus, herpes simplex virus and cytomegalovirus in a cross-sectional study in Mexico.Vaccine. 2013 Oct 17;31(44):5067-74. doi: 10.1016/j.vaccine.2013.08.077. Epub 2013 Sep 7. Vaccine. 2013. PMID: 24021305
-
Review and meta-analysis of the epidemiology of congenital cytomegalovirus (CMV) infection.Rev Med Virol. 2007 Jul-Aug;17(4):253-76. doi: 10.1002/rmv.535. Rev Med Virol. 2007. PMID: 17579921 Review.
-
Review of cytomegalovirus seroprevalence and demographic characteristics associated with infection.Rev Med Virol. 2010 Jul;20(4):202-13. doi: 10.1002/rmv.655. Rev Med Virol. 2010. PMID: 20564615 Review.
Cited by
-
Estimating the cumulative incidence of SARS-CoV-2 with imperfect serological tests: Exploiting cutoff-free approaches.PLoS Comput Biol. 2021 Feb 26;17(2):e1008728. doi: 10.1371/journal.pcbi.1008728. eCollection 2021 Feb. PLoS Comput Biol. 2021. PMID: 33635863 Free PMC article.
-
Limited effect of duration of CMV infection on adaptive immunity and frailty: insights from a 27-year-long longitudinal study.Clin Transl Immunology. 2020 Oct 14;9(10):e1193. doi: 10.1002/cti2.1193. eCollection 2020. Clin Transl Immunology. 2020. PMID: 33133599 Free PMC article.
-
Aging and lymphocyte changes by immunomodulatory therapies impact PML risk in multiple sclerosis patients.Mult Scler. 2018 Jul;24(8):1014-1022. doi: 10.1177/1352458518775550. Epub 2018 May 18. Mult Scler. 2018. PMID: 29774781 Free PMC article. Review.
-
Development of a CRISPR-Cas12a rapid diagnostic for human cytomegalovirus.Antiviral Res. 2023 Jul;215:105624. doi: 10.1016/j.antiviral.2023.105624. Epub 2023 May 5. Antiviral Res. 2023. PMID: 37150408 Free PMC article.
-
Effect of latent cytomegalovirus infection on the antibody response to influenza vaccination: a systematic review and meta-analysis.Med Microbiol Immunol. 2019 Aug;208(3-4):305-321. doi: 10.1007/s00430-019-00602-z. Epub 2019 Apr 4. Med Microbiol Immunol. 2019. PMID: 30949763 Free PMC article.
References
MeSH terms
LinkOut - more resources
Full Text Sources
Other Literature Sources
Medical
