

Phylogenetic Factor Analysis
- PMID: 28950376
- PMCID: PMC5920329
- DOI: 10.1093/sysbio/syx066
Phylogenetic Factor Analysis
Abstract
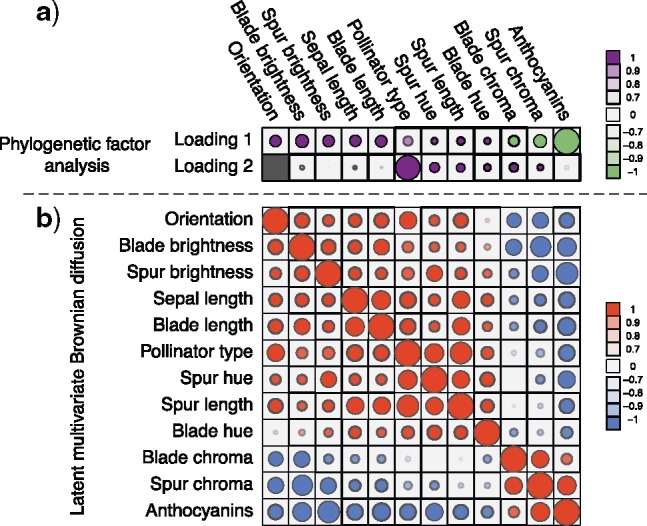
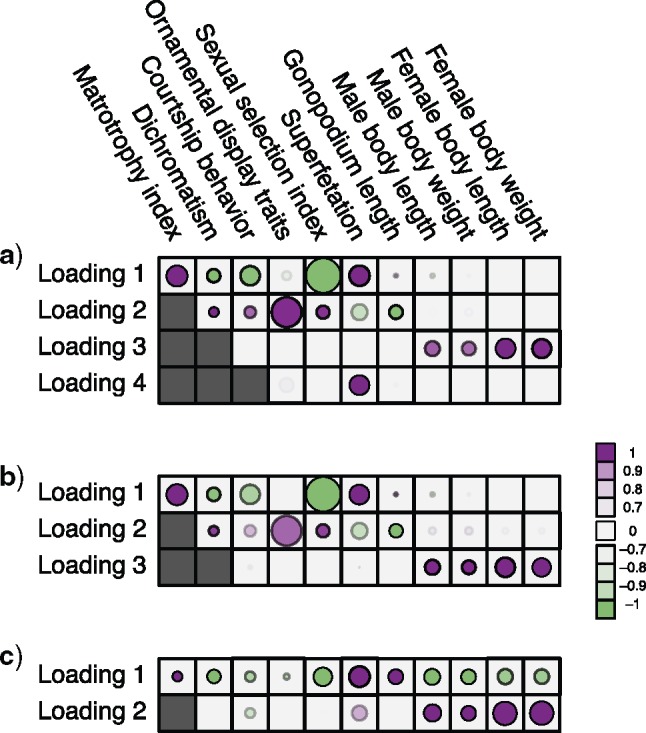
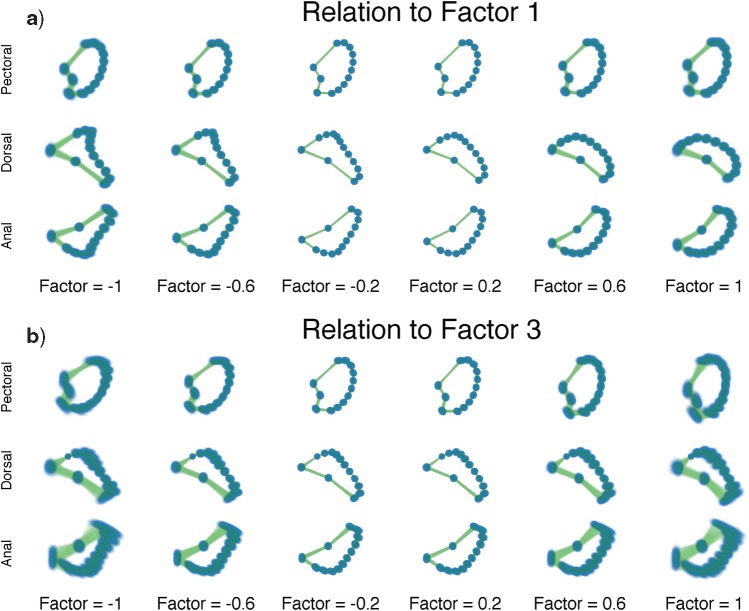
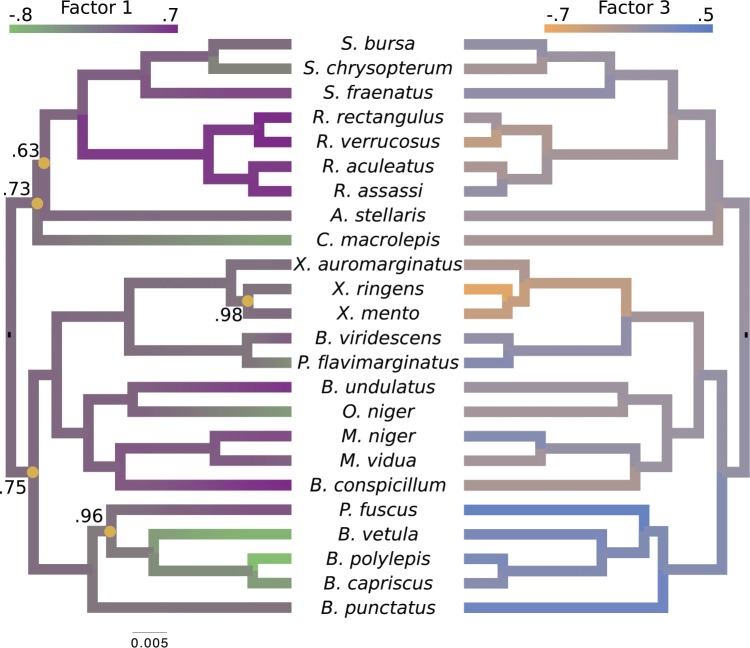
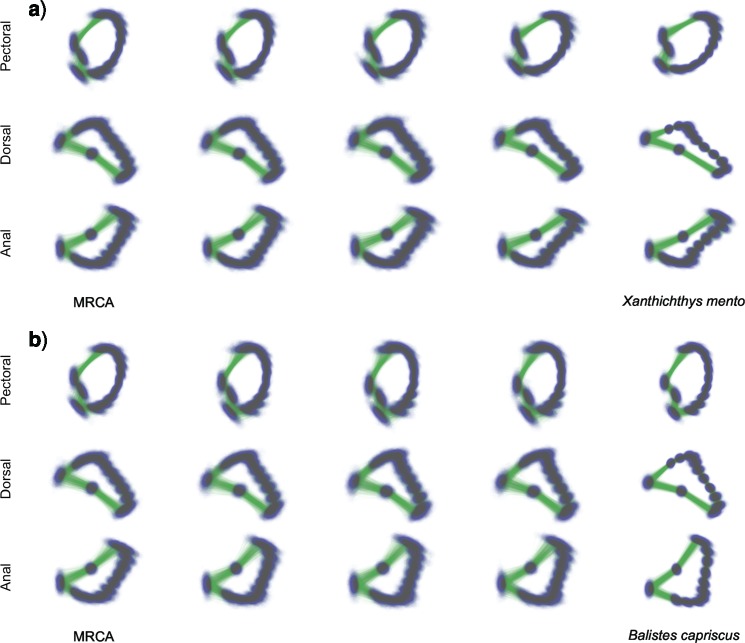
Phylogenetic comparative methods explore the relationships between quantitative traits adjusting for shared evolutionary history. This adjustment often occurs through a Brownian diffusion process along the branches of the phylogeny that generates model residuals or the traits themselves. For high-dimensional traits, inferring all pair-wise correlations within the multivariate diffusion is limiting. To circumvent this problem, we propose phylogenetic factor analysis (PFA) that assumes a small unknown number of independent evolutionary factors arise along the phylogeny and these factors generate clusters of dependent traits. Set in a Bayesian framework, PFA provides measures of uncertainty on the factor number and groupings, combines both continuous and discrete traits, integrates over missing measurements and incorporates phylogenetic uncertainty with the help of molecular sequences. We develop Gibbs samplers based on dynamic programming to estimate the PFA posterior distribution, over 3-fold faster than for multivariate diffusion and a further order-of-magnitude more efficiently in the presence of latent traits. We further propose a novel marginal likelihood estimator for previously impractical models with discrete data and find that PFA also provides a better fit than multivariate diffusion in evolutionary questions in columbine flower development, placental reproduction transitions and triggerfish fin morphometry.
Figures
Similar articles
-
Marginal Likelihoods in Phylogenetics: A Review of Methods and Applications.Syst Biol. 2019 Sep 1;68(5):681-697. doi: 10.1093/sysbio/syz003. Syst Biol. 2019. PMID: 30668834 Free PMC article. Review.
-
Likelihood-Based Parameter Estimation for High-Dimensional Phylogenetic Comparative Models: Overcoming the Limitations of "Distance-Based" Methods.Syst Biol. 2016 Sep;65(5):852-70. doi: 10.1093/sysbio/syw051. Epub 2016 Jun 16. Syst Biol. 2016. PMID: 27316673
-
A phylogenetic model for investigating correlated evolution of substitution rates and continuous phenotypic characters.Mol Biol Evol. 2011 Jan;28(1):729-44. doi: 10.1093/molbev/msq244. Epub 2010 Oct 6. Mol Biol Evol. 2011. PMID: 20926596
-
A Penalized Likelihood Framework for High-Dimensional Phylogenetic Comparative Methods and an Application to New-World Monkeys Brain Evolution.Syst Biol. 2019 Jan 1;68(1):93-116. doi: 10.1093/sysbio/syy045. Syst Biol. 2019. PMID: 29931145
-
Multivariate Phylogenetic Comparative Methods: Evaluations, Comparisons, and Recommendations.Syst Biol. 2018 Jan 1;67(1):14-31. doi: 10.1093/sysbio/syx055. Syst Biol. 2018. PMID: 28633306 Review.
Cited by
-
Leveraging graphical model techniques to study evolution on phylogenetic networks.Philos Trans R Soc Lond B Biol Sci. 2025 Feb 13;380(1919):20230310. doi: 10.1098/rstb.2023.0310. Epub 2025 Feb 20. Philos Trans R Soc Lond B Biol Sci. 2025. PMID: 39976402 Review.
-
Principled, practical, flexible, fast: a new approach to phylogenetic factor analysis.Methods Ecol Evol. 2022 Oct;13(10):2181-2197. doi: 10.1111/2041-210X.13920. Epub 2022 Jun 19. Methods Ecol Evol. 2022. PMID: 36908682 Free PMC article.
-
Diel activity correlates with colour pattern morphology of heterobranch sea slugs.J Anim Ecol. 2025 Jun;94(6):1165-1179. doi: 10.1111/1365-2656.70036. Epub 2025 Apr 15. J Anim Ecol. 2025. PMID: 40235033 Free PMC article.
-
Marginal Likelihoods in Phylogenetics: A Review of Methods and Applications.Syst Biol. 2019 Sep 1;68(5):681-697. doi: 10.1093/sysbio/syz003. Syst Biol. 2019. PMID: 30668834 Free PMC article. Review.
-
Accelerating Bayesian inference of dependency between mixed-type biological traits.PLoS Comput Biol. 2023 Aug 28;19(8):e1011419. doi: 10.1371/journal.pcbi.1011419. eCollection 2023 Aug. PLoS Comput Biol. 2023. PMID: 37639445 Free PMC article.
References
-
- Adams D. 2014. A method for assessing phylogenetic least squares models for shape and other high-dimensional multivariate data. Evolution 68(9): 2675–2688. - PubMed
-
- Aguilar O.,, West M. 2000. Bayesian dynamic factor models and portfolio allocation. J. Bus. Econ. Stat. 18:338–357.
-
- Beguin A.,, Glas C. 2001. MCMC estimation and some model-fit analysis of multidimensional IRT models. Psychometrika 66:541–562.
