

Continental-scale, data-driven predictive assessment of eliminating the vector-borne disease, lymphatic filariasis, in sub-Saharan Africa by 2020
- PMID: 28950862
- PMCID: PMC5615442
- DOI: 10.1186/s12916-017-0933-2
Continental-scale, data-driven predictive assessment of eliminating the vector-borne disease, lymphatic filariasis, in sub-Saharan Africa by 2020
Abstract
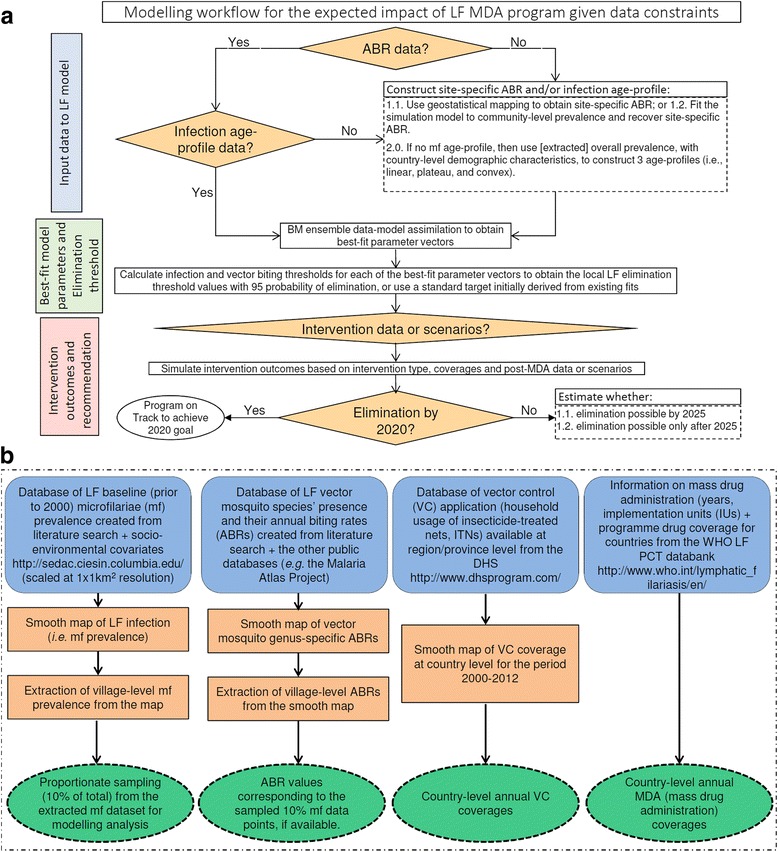
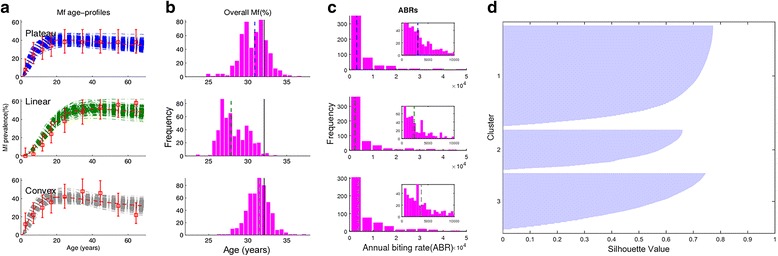
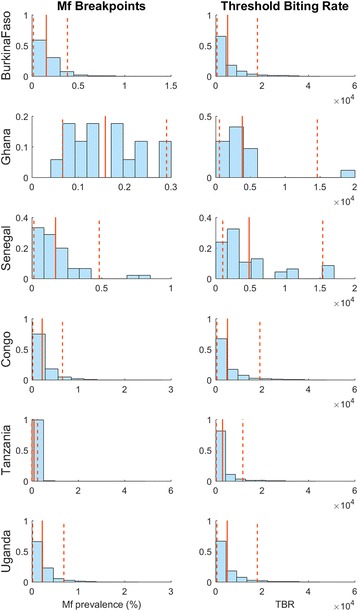
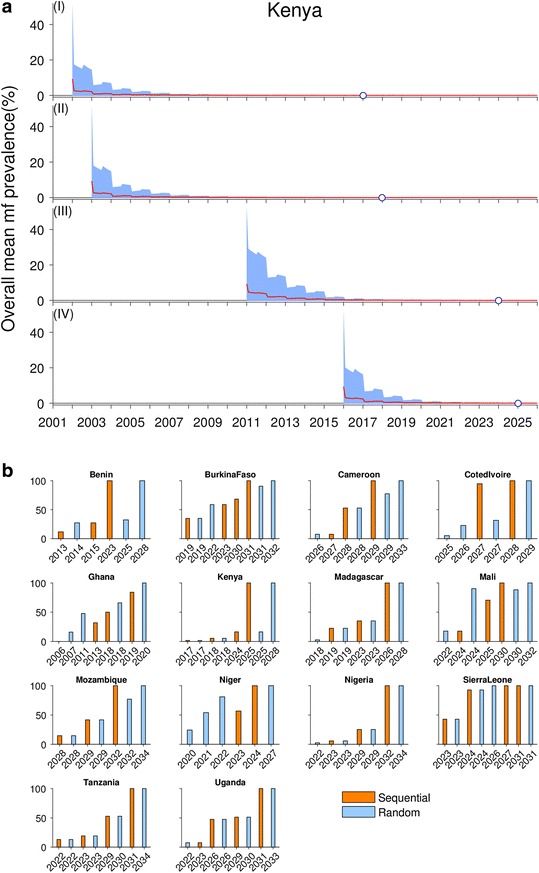
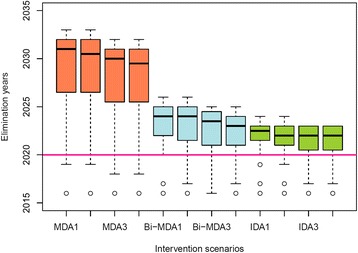
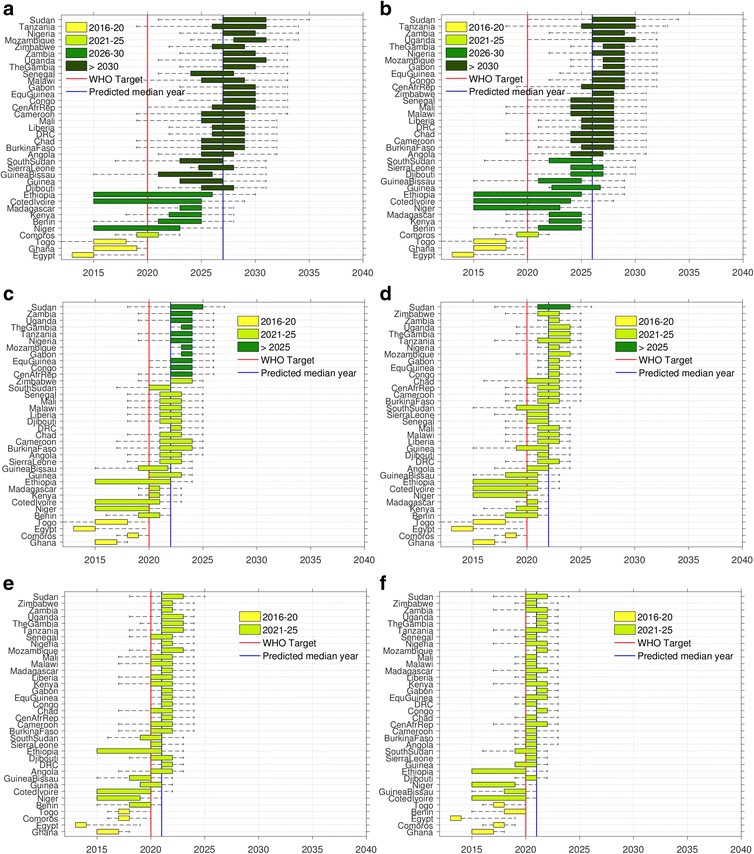
Background: There are growing demands for predicting the prospects of achieving the global elimination of neglected tropical diseases as a result of the institution of large-scale nation-wide intervention programs by the WHO-set target year of 2020. Such predictions will be uncertain due to the impacts that spatial heterogeneity and scaling effects will have on parasite transmission processes, which will introduce significant aggregation errors into any attempt aiming to predict the outcomes of interventions at the broader spatial levels relevant to policy making. We describe a modeling platform that addresses this problem of upscaling from local settings to facilitate predictions at regional levels by the discovery and use of locality-specific transmission models, and we illustrate the utility of using this approach to evaluate the prospects for eliminating the vector-borne disease, lymphatic filariasis (LF), in sub-Saharan Africa by the WHO target year of 2020 using currently applied or newly proposed intervention strategies. METHODS AND RESULTS: We show how a computational platform that couples site-specific data discovery with model fitting and calibration can allow both learning of local LF transmission models and simulations of the impact of interventions that take a fuller account of the fine-scale heterogeneous transmission of this parasitic disease within endemic countries. We highlight how such a spatially hierarchical modeling tool that incorporates actual data regarding the roll-out of national drug treatment programs and spatial variability in infection patterns into the modeling process can produce more realistic predictions of timelines to LF elimination at coarse spatial scales, ranging from district to country to continental levels. Our results show that when locally applicable extinction thresholds are used, only three countries are likely to meet the goal of LF elimination by 2020 using currently applied mass drug treatments, and that switching to more intensive drug regimens, increasing the frequency of treatments, or switching to new triple drug regimens will be required if LF elimination is to be accelerated in Africa. The proportion of countries that would meet the goal of eliminating LF by 2020 may, however, reach up to 24/36 if the WHO 1% microfilaremia prevalence threshold is used and sequential mass drug deliveries are applied in countries.
Conclusions: We have developed and applied a data-driven spatially hierarchical computational platform that uses the discovery of locally applicable transmission models in order to predict the prospects for eliminating the macroparasitic disease, LF, at the coarser country level in sub-Saharan Africa. We show that fine-scale spatial heterogeneity in local parasite transmission and extinction dynamics, as well as the exact nature of intervention roll-outs in countries, will impact the timelines to achieving national LF elimination on this continent.
Keywords: Data discovery; Data-driven parasite transmission modeling; Hierarchical modeling; Lymphatic filariasis; Mass drug administration; Neglected tropical diseases; Parasite elimination programs; Parasite transmission heterogeneity; Scientific computational discovery of knowledge; Spatial scale; Sub-Saharan Africa; Vector control; Vector-borne diseases.
Conflict of interest statement
Ethics approval and consent to participate
Not applicable.
Consent for publication
Not applicable.
Competing interests
The authors declare that they have no competing interests.
Publisher’s Note
Springer Nature remains neutral with regard to jurisdictional claims in published maps and institutional affiliations.
Figures
Similar articles
-
Heterogeneous dynamics, robustness/fragility trade-offs, and the eradication of the macroparasitic disease, lymphatic filariasis.BMC Med. 2016 Jan 28;14:14. doi: 10.1186/s12916-016-0557-y. BMC Med. 2016. PMID: 26822124 Free PMC article.
-
Bayesian calibration of simulation models for supporting management of the elimination of the macroparasitic disease, Lymphatic Filariasis.Parasit Vectors. 2015 Oct 22;8:522. doi: 10.1186/s13071-015-1132-7. Parasit Vectors. 2015. PMID: 26490350 Free PMC article.
-
Geographic and ecologic heterogeneity in elimination thresholds for the major vector-borne helminthic disease, lymphatic filariasis.BMC Biol. 2010 Mar 17;8:22. doi: 10.1186/1741-7007-8-22. BMC Biol. 2010. PMID: 20236528 Free PMC article.
-
The Role of Spatial Statistics in the Control and Elimination of Neglected Tropical Diseases in Sub-Saharan Africa: A Focus on Human African Trypanosomiasis, Schistosomiasis and Lymphatic Filariasis.Adv Parasitol. 2017;97:187-241. doi: 10.1016/bs.apar.2017.01.001. Epub 2017 Mar 9. Adv Parasitol. 2017. PMID: 28325371 Review.
-
Elimination of lymphatic filariasis in west African urban areas: is implementation of mass drug administration necessary?Lancet Infect Dis. 2018 Jun;18(6):e214-e220. doi: 10.1016/S1473-3099(18)30069-0. Epub 2018 Feb 3. Lancet Infect Dis. 2018. PMID: 29402636 Review.
Cited by
-
Economic performance and cost-effectiveness of using a DEC-salt social enterprise for eliminating the major neglected tropical disease, lymphatic filariasis.PLoS Negl Trop Dis. 2019 Jul 1;13(7):e0007094. doi: 10.1371/journal.pntd.0007094. eCollection 2019 Jul. PLoS Negl Trop Dis. 2019. PMID: 31260444 Free PMC article.
-
Iterative data-driven forecasting of the transmission and management of SARS-CoV-2/COVID-19 using social interventions at the county-level.Sci Rep. 2022 Jan 18;12(1):890. doi: 10.1038/s41598-022-04899-4. Sci Rep. 2022. PMID: 35042958 Free PMC article.
-
The global distribution of lymphatic filariasis, 2000-18: a geospatial analysis.Lancet Glob Health. 2020 Sep;8(9):e1186-e1194. doi: 10.1016/S2214-109X(20)30286-2. Lancet Glob Health. 2020. PMID: 32827480 Free PMC article.
-
Evaluating the Evidence for Lymphatic Filariasis Elimination.Trends Parasitol. 2019 Nov;35(11):860-869. doi: 10.1016/j.pt.2019.08.003. Epub 2019 Sep 7. Trends Parasitol. 2019. PMID: 31506245 Free PMC article. Review.
-
Five years of post-validation surveillance of lymphatic filariasis in Thailand.Infect Dis Poverty. 2023 Dec 6;12(1):113. doi: 10.1186/s40249-023-01158-0. Infect Dis Poverty. 2023. PMID: 38053222 Free PMC article.
References
-
- French MD, Churcher TS, Webster JP, Fleming FM, Fenwick A, Kabatereine NB, Sacko M, Garba A, Toure S, Nyandindi U, et al. Estimation of changes in the force of infection for intestinal and urogenital schistosomiasis in countries with schistosomiasis control initiative-assisted programmes. Parasit Vectors. 2015;8:558. doi: 10.1186/s13071-015-1138-1. - DOI - PMC - PubMed
-
- Gurarie D, Yoon N, Li E, Ndeffo-Mbah M, Durham D, Phillips AE, Aurelio HO, Ferro J, Galvani AP, King CH. Modelling control of Schistosoma haematobium infection: predictions of the long-term impact of mass drug administration in Africa. Parasit Vectors. 2015;8:529. doi: 10.1186/s13071-015-1144-3. - DOI - PMC - PubMed
Publication types
MeSH terms
LinkOut - more resources
Full Text Sources
Other Literature Sources
Molecular Biology Databases
