

Temporal dynamics in microbial soil communities at anthrax carcass sites
- PMID: 28950879
- PMCID: PMC5615460
- DOI: 10.1186/s12866-017-1111-6
Temporal dynamics in microbial soil communities at anthrax carcass sites
Abstract
Background: Anthrax is a globally distributed disease affecting primarily herbivorous mammals. It is caused by the soil-dwelling and spore-forming bacterium Bacillus anthracis. The dormant B. anthracis spores become vegetative after ingestion by grazing mammals. After killing the host, B. anthracis cells return to the soil where they sporulate, completing the lifecycle of the bacterium. Here we present the first study describing temporal microbial soil community changes in Etosha National Park, Namibia, after decomposition of two plains zebra (Equus quagga) anthrax carcasses. To circumvent state-associated-challenges (i.e. vegetative cells/spores) we monitored B. anthracis throughout the period using cultivation, qPCR and shotgun metagenomic sequencing.
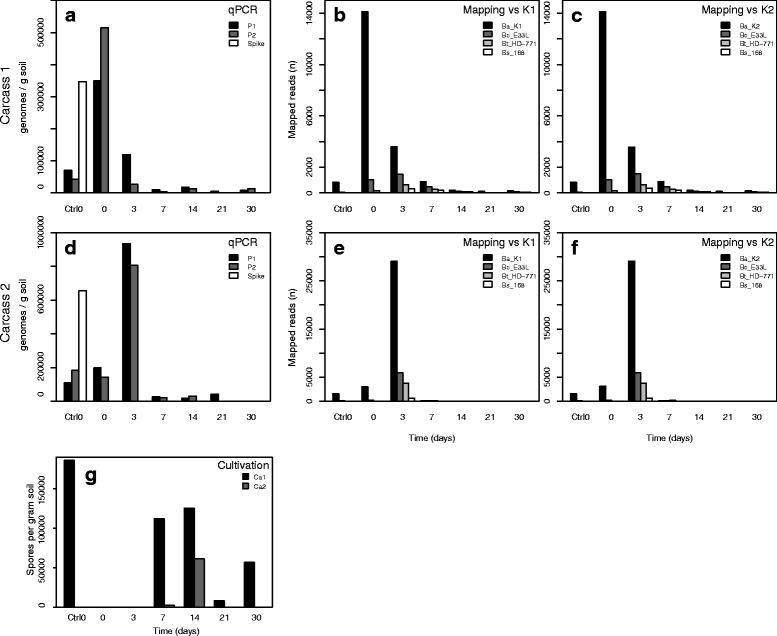
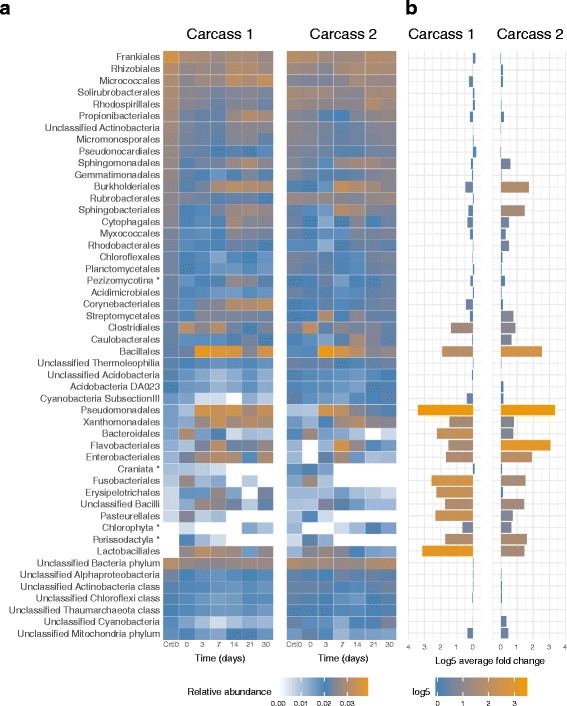
Results: The combined results suggest that abundance estimation of spore-forming bacteria in their natural habitat by DNA-based approaches alone is insufficient due to poor recovery of DNA from spores. However, our combined approached allowed us to follow B. anthracis population dynamics (vegetative cells and spores) in the soil, along with closely related organisms from the B. cereus group, despite their high sequence similarity. Vegetative B. anthracis abundance peaked early in the time-series and then dropped when cells either sporulated or died. The time-series revealed that after carcass deposition, the typical semi-arid soil community (e.g. Frankiales and Rhizobiales species) becomes temporarily dominated by the orders Bacillales and Pseudomonadales, known to contain plant growth-promoting species.
Conclusion: Our work indicates that complementing DNA based approaches with cultivation may give a more complete picture of the ecology of spore forming pathogens. Furthermore, the results suggests that the increased vegetation biomass production found at carcass sites is due to both added nutrients and the proliferation of microbial taxa that can be beneficial for plant growth. Thus, future B. anthracis transmission events at carcass sites may be indirectly facilitated by the recruitment of plant-beneficial bacteria.
Keywords: Bacillus anthracis; Metabolism; Metagenomics; Microbial diversity; Semi-arid; Shotgun sequencing; Sporulation; Taphonomy; Time-series analysis.
Conflict of interest statement
Ethics approval and consent to participate
Not applicable.
Competing interests
The authors declare that they have no competing interests.
Publisher’s Note
Springer Nature remains neutral with regard to jurisdictional claims in published maps and institutional affiliations.
Figures
Similar articles
-
The persistence of time: the lifespan of Bacillus anthracis spores in environmental reservoirs.Res Microbiol. 2023 Jul-Aug;174(6):104029. doi: 10.1016/j.resmic.2023.104029. Epub 2023 Jan 28. Res Microbiol. 2023. PMID: 36720294
-
Spores and soil from six sides: interdisciplinarity and the environmental biology of anthrax (Bacillus anthracis).Biol Rev Camb Philos Soc. 2018 Nov;93(4):1813-1831. doi: 10.1111/brv.12420. Epub 2018 May 6. Biol Rev Camb Philos Soc. 2018. PMID: 29732670 Review.
-
DUST-BATHING BEHAVIORS OF AFRICAN HERBIVORES AND THE POTENTIAL RISK OF INHALATIONAL ANTHRAX.J Wildl Dis. 2018 Jan;54(1):34-44. doi: 10.7589/2017-04-069. Epub 2017 Oct 20. J Wildl Dis. 2018. PMID: 29053428
-
Fatal attraction: vegetation responses to nutrient inputs attract herbivores to infectious anthrax carcass sites.Proc Biol Sci. 2014 Nov 22;281(1795):20141785. doi: 10.1098/rspb.2014.1785. Proc Biol Sci. 2014. PMID: 25274365 Free PMC article.
-
The ecology of anthrax spores: tough but not invincible.Can Vet J. 1995 May;36(5):295-301. Can Vet J. 1995. PMID: 7773917 Free PMC article. Review.
Cited by
-
Identification of the molecular characteristics of Bacillus anthracis (1982-2020) isolates in East Indonesia using multilocus variable-number tandem repeat analysis.Vet World. 2022 Apr;15(4):953-961. doi: 10.14202/vetworld.2022.953-961. Epub 2022 Apr 16. Vet World. 2022. PMID: 35698492 Free PMC article.
-
Composition and functional diversity of bacterial communities during swine carcass decomposition.Anim Biosci. 2023 Sep;36(9):1453-1464. doi: 10.5713/ab.23.0140. Epub 2023 Jun 26. Anim Biosci. 2023. PMID: 37402447 Free PMC article.
-
Changes in Microbial Communities Using Pigs as a Model for Postmortem Interval Estimation.Microorganisms. 2023 Nov 20;11(11):2811. doi: 10.3390/microorganisms11112811. Microorganisms. 2023. PMID: 38004822 Free PMC article.
-
The Bacillus cereus Group: Bacillus Species with Pathogenic Potential.Microbiol Spectr. 2019 May;7(3):10.1128/microbiolspec.gpp3-0032-2018. doi: 10.1128/microbiolspec.GPP3-0032-2018. Microbiol Spectr. 2019. PMID: 31111815 Free PMC article. Review.
-
Detection of Bacillus anthracis and Bacillus anthracis-like spores in soil from state of Rio de Janeiro, Brazil.Mem Inst Oswaldo Cruz. 2020 Nov 6;115:e200370. doi: 10.1590/0074-02760200370. eCollection 2020. Mem Inst Oswaldo Cruz. 2020. PMID: 33174903 Free PMC article.
References
-
- Fierer N, Leff JW, Adams BJ, Nielsen UN, Bates ST, Lauber CL, Owens S, Gilbert JA, Wall DH, Caporaso JG. Cross-biome metagenomic analyses of soil microbial communities and their functional attributes. Proc Natl Acad Sci U S A. 2012;109(52):21390–21395. doi: 10.1073/pnas.1215210110. - DOI - PMC - PubMed
-
- Johnson SL, Kuske CR, Carney TD, Housman DC, Gallegos-Graves LV, Belnap J. Increased temperature and altered summer precipitation have differential effects on biological soil crusts in a dryland ecosystem. Glob Chang Biol. 2012;18(8):2583–2593. doi: 10.1111/j.1365-2486.2012.02709.x. - DOI
MeSH terms
Substances
LinkOut - more resources
Full Text Sources
Other Literature Sources
Medical
