. 2018 Jan;13(1):112-123.
doi: 10.1016/j.jtho.2017.09.1951. Epub 2017 Sep 23.

Longitudinal Cell-Free DNA Analysis in Patients with Small Cell Lung Cancer Reveals Dynamic Insights into Treatment Efficacy and Disease Relapse

Affiliations

Longitudinal Cell-Free DNA Analysis in Patients with Small Cell Lung Cancer Reveals Dynamic Insights into Treatment Efficacy and Disease Relapse

Karinna Almodovar et al. J Thorac Oncol. 2018 Jan.

Abstract

Introduction: Patients with SCLC have a poor prognosis and limited treatment options. Because access to longitudinal tumor samples is very limited in patients with this disease, we chose to focus our studies on the characterization of plasma cell-free DNA (cfDNA) for rapid, noninvasive monitoring of disease burden.

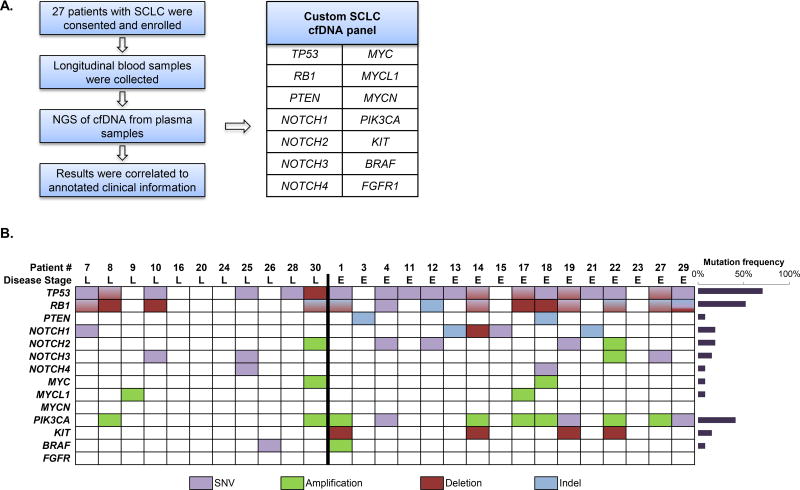
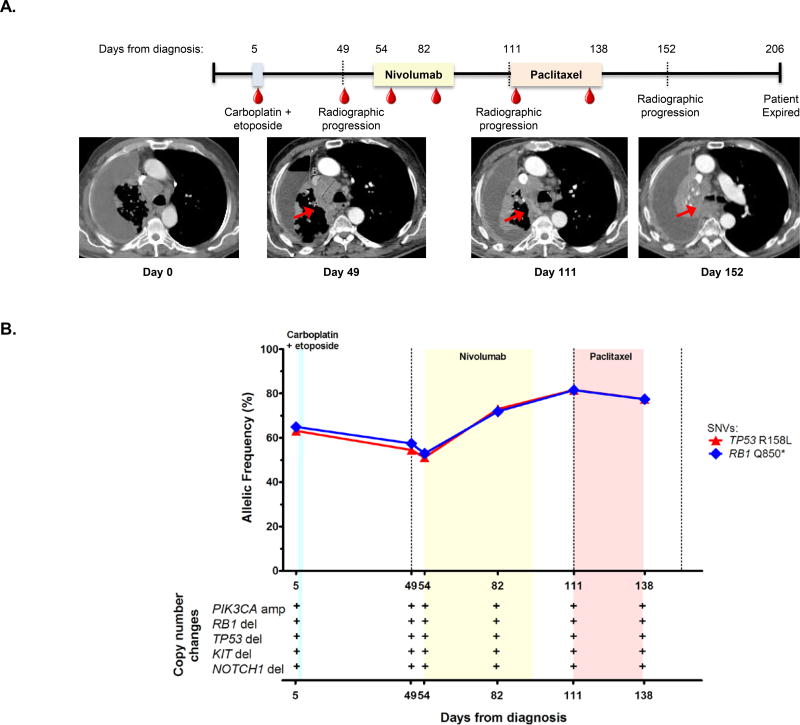
Methods: We developed a liquid biopsy assay that quantifies somatic variants in cfDNA. The assay detects single nucleotide variants, copy number alterations, and insertions or deletions in 14 genes that are frequently mutated in SCLC, including tumor protein p53 gene (TP53), retinoblastoma 1 gene (RB1), BRAF, KIT proto-oncogene receptor tyrosine kinase gene (KIT), notch 1 gene (NOTCH1), notch 2 gene (NOTCH2), notch 3 gene (NOTCH3), notch 4 gene (NOTCH4), phosphatidylinositol-4,5-bisphosphate 3-kinase catalytic subunit alpha gene (PIK3CA), phosphatase and tensin homolog gene (PTEN), fibroblast growth factor receptor 1 gene (FGFR1), v-myc avian myelocytomatosis viral oncogene homolog gene (MYC), v-myc avian myelocytomatosis viral oncogene lung carcinoma derived homolog gene (MYCL1), and v-myc avian myelocytomatosis viral oncogene neuroblastoma derived homolog gene (MYCN).

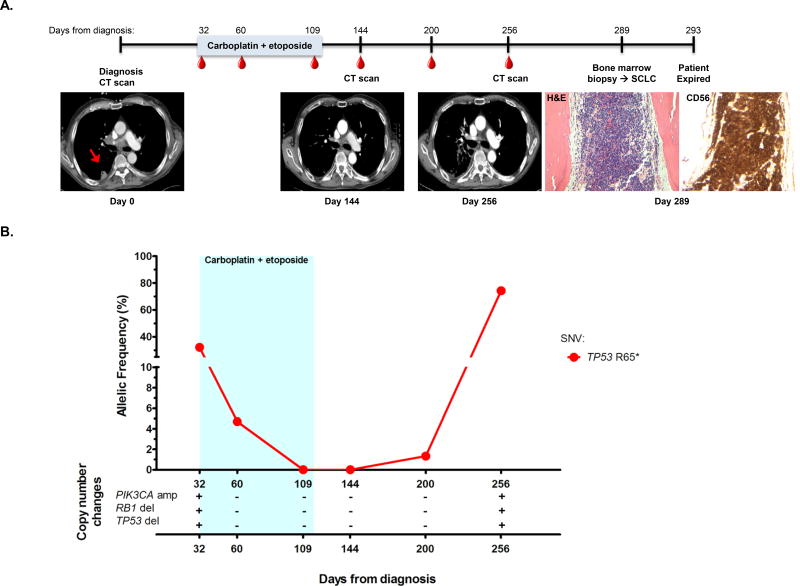
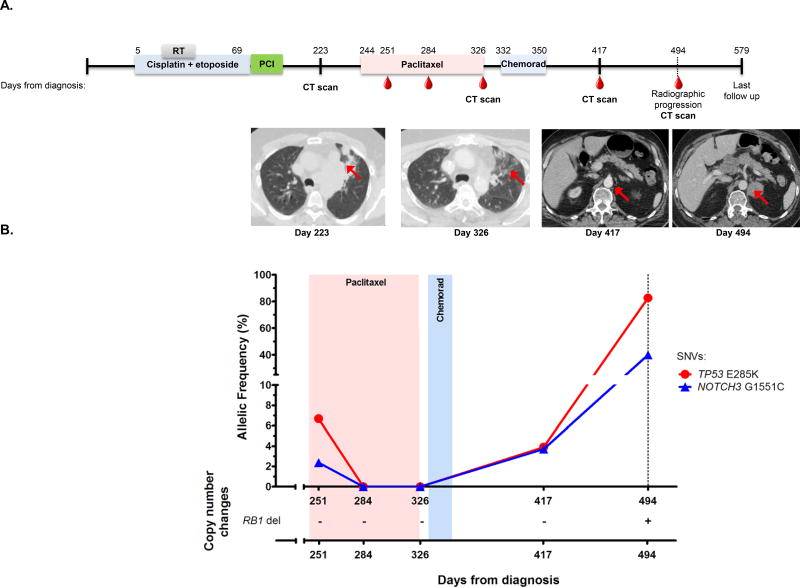
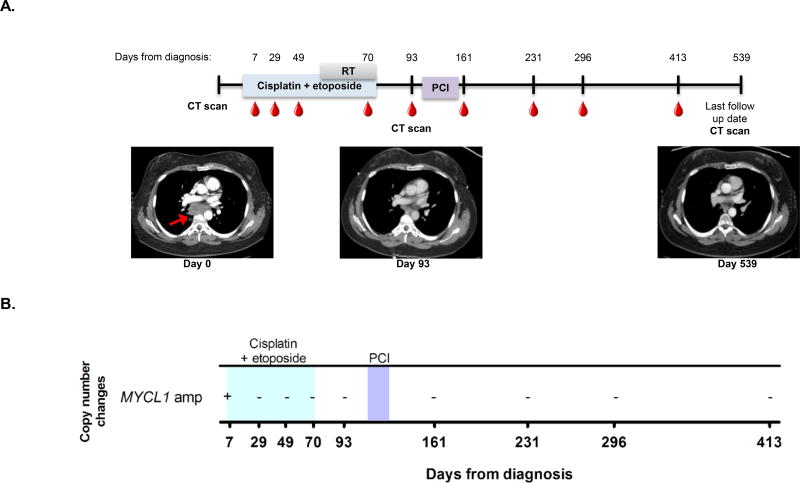
Results: Over the course of 26 months of peripheral blood collection, we examined 140 plasma samples from 27 patients. We detected disease-associated mutations in 85% of patient samples with mutant allele frequencies ranging from 0.1% to 87%. In our cohort, 59% of the patients had extensive-stage disease, and the most common mutations occurred in TP53 (70%) and RB1 (52%). In addition to mutations in TP53 and RB1, we detected alterations in 10 additional genes in our patient population (PTEN, NOTCH1, NOTCH2, NOTCH3, NOTCH4, MYC, MYCL1, PIK3CA, KIT, and BRAF). The observed allele frequencies and copy number alterations tracked closely with treatment responses. Notably, in several cases analysis of cfDNA provided evidence of disease relapse before conventional imaging.

Conclusions: These results suggest that liquid biopsies are readily applicable in patients with SCLC and can potentially provide improved monitoring of disease burden, depth of response to treatment, and timely warning of disease relapse in patients with this disease.

Keywords: Cell-free tumor DNA; Liquid biopsy; Next-generation sequencing; Plasma; Small cell lung cancer.


Conflict of interest statement

Author disclosures: CML has served as a consultant for Pfizer, Novartis, Astra Zeneca, Genoptix, Sequenom, and Ariad and has been an invited speaker for Abbott and Qiagen. LH is a consultant for Abbvie, Bayer, Bristol Myers Squibb, Eli Lilly, Merck, Roche, and Xcovery. JH, LPL, and CKR have an ownership stake and are employees of Resolution Biosciences. KA, WTI, CBM, YY, ZZ, HC, and YS report no conflicts of interest.

Figures

Figure 1
Figure 1. Mutational analysis in plasma cfDNA from 27 patients using next-generation sequencing
(A) Study overview. (B) Summary of mutations identified by individual patients at any time point. Patients are separated by stage of disease at diagnosis (L: limited stage; E: extensive stage). Alterations are color coded per the figure legend below the image. The mutation frequencies for each gene are plotted on the right panel.
Figure 2
Figure 2. cfDNA detection precedes clinical or radiographic disease progression
(A) The timeline for patient VSC-8’s clinical course from diagnosis until date of death is shown. The light blue colored bar represents the treatment timeframe, and the red dots indicate blood collections. Radiographic images were acquired at the time of diagnosis, day 144, and day 256. The red arrow in the first CT scan shows the right pleural based primary tumor which resolved on further imaging. Bone marrow biopsy was performed on day 289 and assessed for common SCLC markers, including CD56 (H&E, 200× and CD56 staining, 200×). (B) Percent mutant allelic frequency and copy number alterations for patient VSC-8 are shown. The light blue box indicates treatment timeframe. A plus or minus symbol (+/−) indicates presence/absence of the copy number alteration listed. * = stop. amp = amplification. del = deletion.
Figure 3
Figure 3. cfDNA detection can clarify mixed response on imaging
(A) The timeline for patient VSC-10’s clinical course from diagnosis until last follow up date with radiographic images is shown. The colored bars represent the active treatment timeframes, including radiotherapy. The "RT" grey bar indicates radiation therapy, the “PCI” purple bar indicates prophylactic cranial irradiation, and the "chemorad" blue shaded bar represents concurrent chemoradiation with weekly carboplatin and paclitaxel. The red dots indicate blood collection time points. Radiographic images were obtained at time of progression after first line therapy (day 223), day 326, day 417, and day 494. The red arrow at day 223 indicates initially multifocal pulmonary parenchymal disease which resolved after second line paclitaxel (day 326). The subsequent image at day 417 shows a 0.9 cm retroperitoneal lymph node of uncertain etiology. On the day 494 images, the retroperitoneal lymph node enlarged to 3.0 × 2.7 cm. (B) Percent mutant allelic frequencies and copy number alterations for patient VSC-10 are shown. The light red and blue boxes indicate treatment time periods corresponding to labeling on the timeline above. The dotted line indicates the time of radiologic recurrence. A plus or minus symbol (+/−) indicates presence/absence of the copy number alteration listed. del = deletion.
Figure 4
Figure 4. cfDNA changes correspond to remission
(A) The timeline for patient VSC-9’s clinical course from diagnosis until last follow up date with radiographic images is shown. The colored bars represent the treatment timeframes. The "RT" grey bar indicates radiation therapy and the "PCI" purple bar indicates prophylactic cranial irradiation. Radiographic images were obtained at time of diagnosis, day 93, and at last follow up date (day 539). The red arrow shows primary mediastinal disease which resolved on subsequent imaging. (B) Copy number alterations for patient VSC-9 are shown. The blue box indicates the time period during which cisplatin plus etoposide was administered and the purple box indicates prophylactic cranial irradiation treatment. A plus or minus symbol (+/−) indicates presence/absence of the copy number alteration listed. amp = amplification.
Figure 5
Figure 5. cfDNA sequencing enables early identification of treatment refractory disease
(A) The timeline for patient VSC-14’s clinical course from diagnosis until date of death is shown with radiographic images from diagnosis, day 49, day 111, and day 152, demonstrating slow progression in intrathoracic disease despite all therapy. Red arrow indicates primary mediastinal disease. The color bars represent treatment timeframes. The blue color bar represents one cycle of carboplatin and etoposide treatment, the light yellow box represents nivolumab treatment, and the pink box indicates paclitaxel treatment. (B) Percent mutant allelic frequencies and copy number alterations for patient VSC-14 are shown. The light blue, yellow and pink boxes indicate treatment time periods corresponding to labeling on the timeline above. The dotted line indicates the time of radiologic recurrence. A plus or minus symbol (+/−) indicates presence/absence of the copy number alteration listed. * = stop. amp = amplification. del = deletion.

Comment in

References

    1. Torre LA, Siegel RL, Jemal A. Lung Cancer Statistics. Adv Exp Med Biol. 2016;893:1–19. - PubMed
    1. Bernhardt EB, Jalal SI. Small Cell Lung Cancer. Cancer Treat Res. 2016;170:301–322. - PubMed
    1. Chan BA, Coward JI. Chemotherapy advances in small-cell lung cancer. J Thorac Dis. 2013;5(Suppl 5):S565–578. - PMC - PubMed
    1. Ramalingam SS. Small-Cell Lung Cancer: New Directions for Systemic Therapy. J Oncol Pract. 2016;12(2):119–120. - PubMed
    1. Pietanza MC, Byers LA, Minna JD, Rudin CM. Small cell lung cancer: will recent progress lead to improved outcomes? Clin Cancer Res. 2015;21(10):2244–2255. - PMC - PubMed

MeSH terms