. 2017 Nov 1;144(21):3894-3906.
doi: 10.1242/dev.150391. Epub 2017 Sep 26.

Anteroposterior polarity and elongation in the absence of extra-embryonic tissues and of spatially localised signalling in gastruloids: mammalian embryonic organoids

Affiliations

Anteroposterior polarity and elongation in the absence of extra-embryonic tissues and of spatially localised signalling in gastruloids: mammalian embryonic organoids

David A Turner et al. Development. .

Abstract

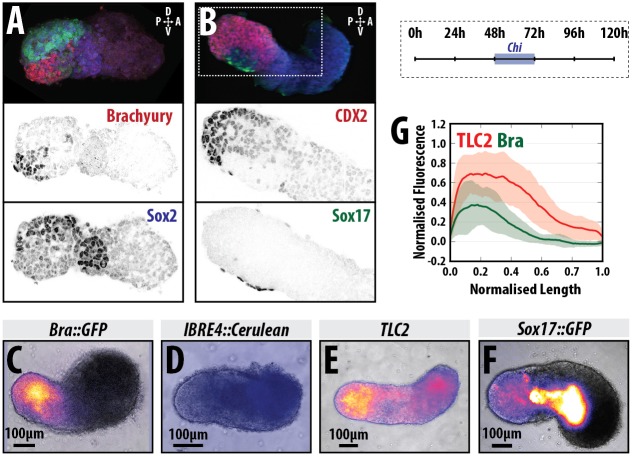
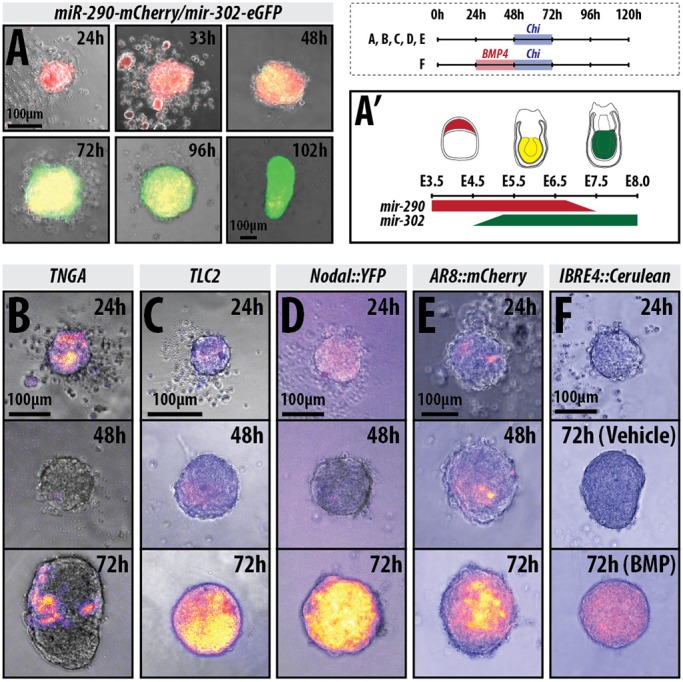
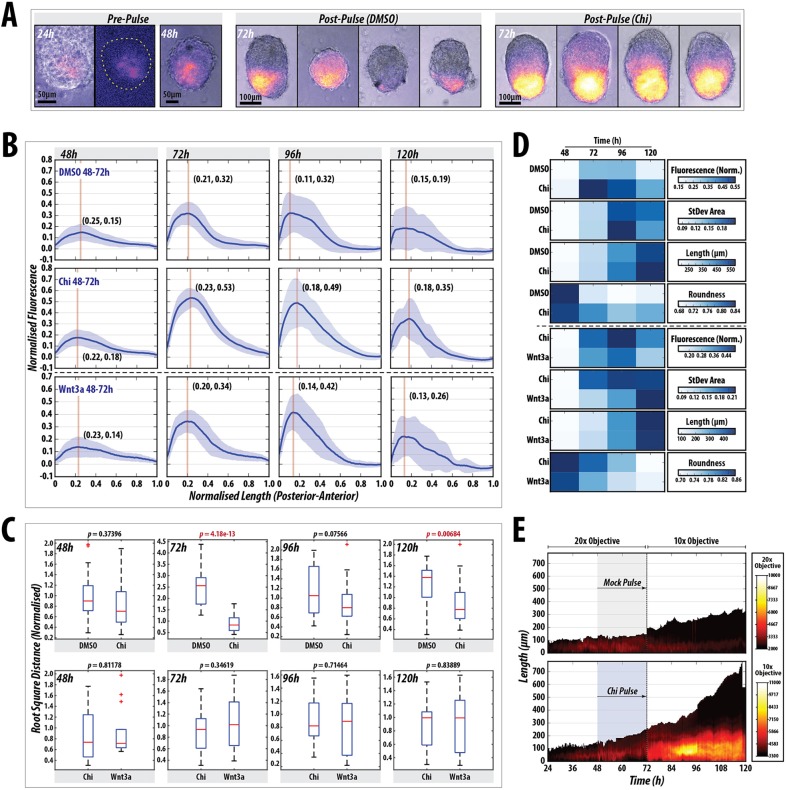
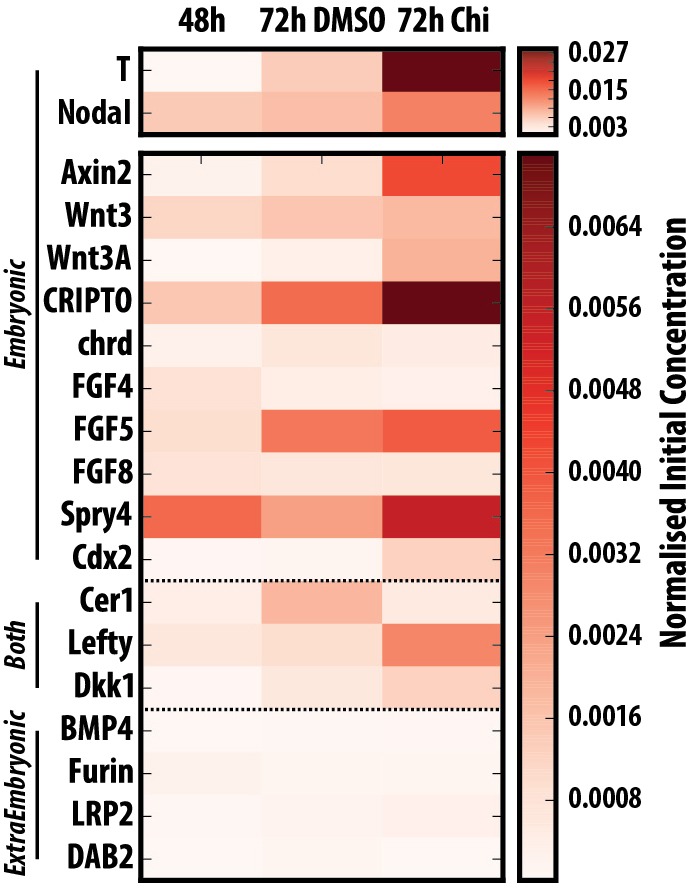
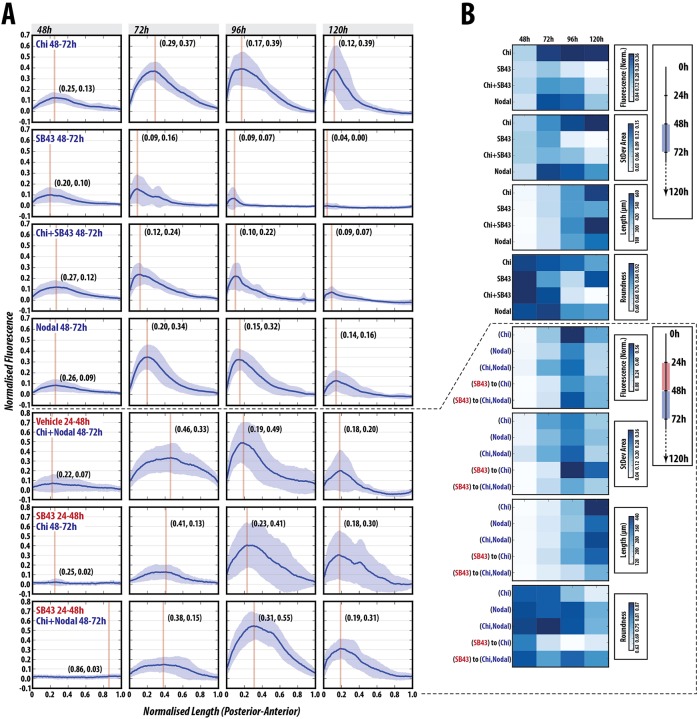
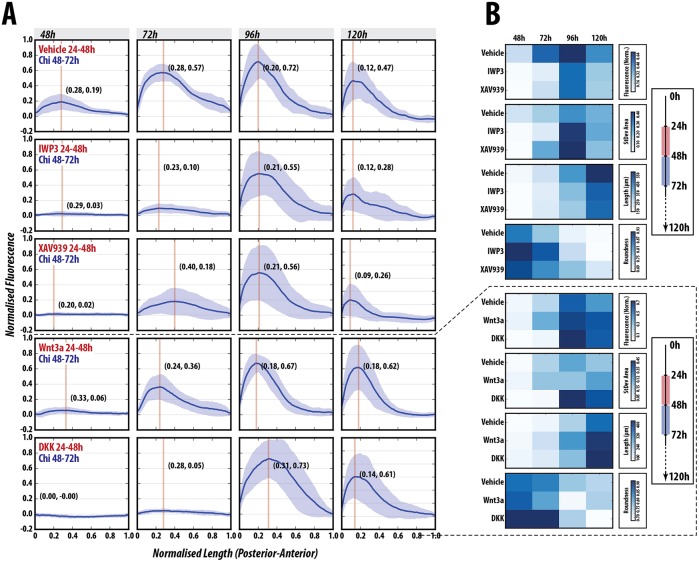
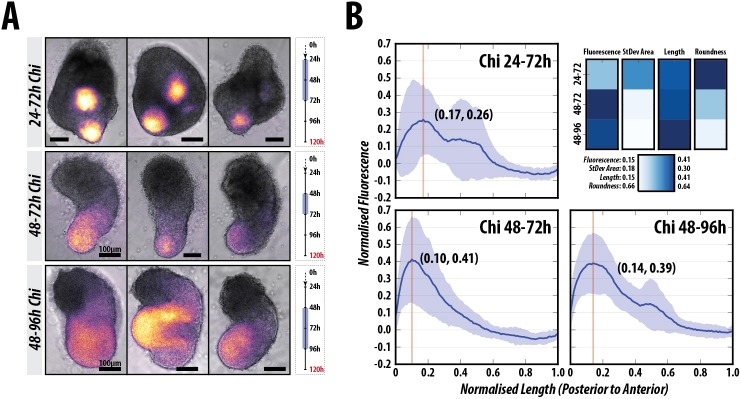
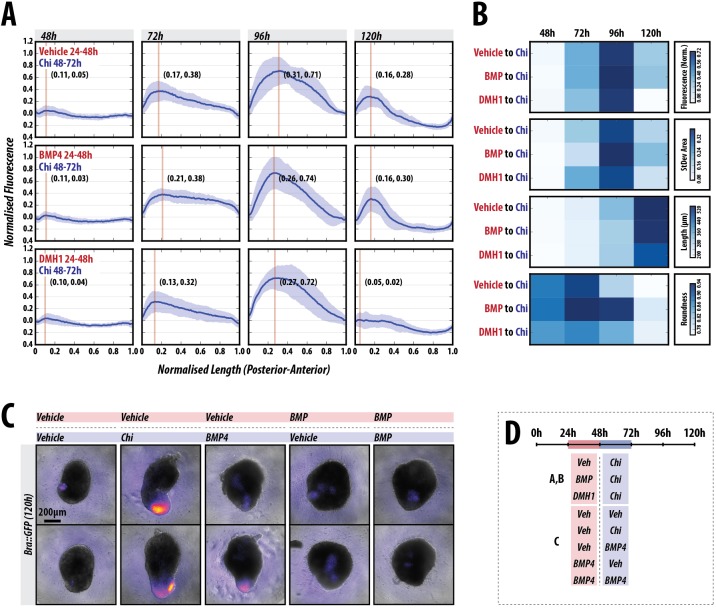
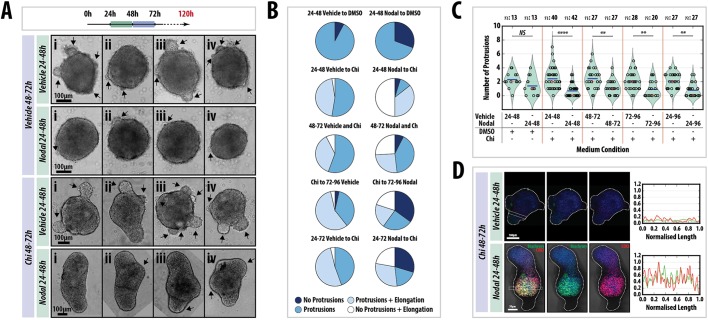
The establishment of the anteroposterior (AP) axis is a crucial step during animal embryo development. In mammals, genetic studies have shown that this process relies on signals spatiotemporally deployed in the extra-embryonic tissues that locate the position of the head and the onset of gastrulation, marked by T/Brachyury (T/Bra) at the posterior of the embryo. Here, we use gastruloids, mESC-based organoids, as a model system with which to study this process. We find that gastruloids localise T/Bra expression to one end and undergo elongation similar to the posterior region of the embryo, suggesting that they develop an AP axis. This process relies on precisely timed interactions between Wnt/β-catenin and Nodal signalling, whereas BMP signalling is dispensable. Additionally, polarised T/Bra expression occurs in the absence of extra-embryonic tissues or localised sources of signals. We suggest that the role of extra-embryonic tissues in the mammalian embryo might not be to induce the axes but to bias an intrinsic ability of the embryo to initially break symmetry. Furthermore, we suggest that Wnt signalling has a separable activity involved in the elongation of the axis.

Keywords: Axial organisation; Gastruloids; Organoids; Symmetry-breaking.


Conflict of interest statement

Competing interestsThe authors declare no competing or financial interests.

Figures

Fig. 1.
Fig. 1.
Axial organisation of gastruloids. (A,B) Sox1::GFP (A) and Nodal::YFP reporter (B) gastruloids pulsed with Chi (48-72 h AA) and stained with Hoechst and anti-GFP with either (A) T/Bra (red) and Sox2 (blue), or (B) Cdx2 (red) and Sox17 (green) at 120 h AA; Hoechst is not shown in A; staining is representative of at least three replicate experiments; 3D projections are displayed. (C-F) Gastruloids formed from T/Bra::GFP (C), BMP (IBRE4::Cerulean; D), Wnt/β-catenin (TLC2; E) and Sox17::GFP (F) reporter lines following a 48-72 h Chi pulse. (G) Quantification of reporter expression for the TLC2 (red) and T/Bra::GFP (green) gastruloids in a posterior-to-anterior direction. Stimulation results in activation of the TLC2 reporter with highest expression at the posterior pole. Schematic for the stimulation regime is shown in the top-right corner. Scale bars: 100 μm in C-F.
Fig. 2.
Fig. 2.
Gastruloids progress through stages similar to the early embryonic to late epiblast. (A) mir-290-mCherry/mir-302-eGFP gastruloids imaged by wide-field microscopy for 102 h (n=6 for 24-48 h and 8 for 72-120 h). The colour changes schematic is shown in A′ (see Parchem et al., 2014 and Turner et al., 2016b). (B-F) Gastruloids made from the (B) TNGA (n=21), (C) TLC2 (24 and 48 h n=84; 72 h n=42), (D) Nodal::YFP (Nodal expression; 24 and 48 h n=84; 72 h n=42) and (E) AR8::mCherry (Nodal signalling; n=14) and (F) IBRE4::Cerulean (BMP reporter; 24 h n=70; 48 and 72 h n=14) cell lines and treated with a pulse of Chi between 48 and 72 h AA (B-E), or pre-treated with a pulse of BMP4 (24-48 h) followed by a pulse of Chi (48-72 h; F). Schematic for the stimulation regime shown in the top-right corner. Scale bars: 100 μm.
Fig. 3.
Fig. 3.
Wnt/β-catenin signalling stabilises and enhances spontaneous symmetry-breaking and polarisation events in gastruloids. (A) T/Bra::GFP expression in gastruloids at 24 and 48 h prior to the Chi pulse (left), and examples of gastruloids following a DMSO or Chi pulse (n=28). Chi-mediated stimulation increases the robustness of the response and reproducibility of the phenotype. (B) Quantification of T/Bra::GFP reporter expression in individual gastruloids over time following DMSO (n=28), Chi (n=28) or Wnt3a (n=14) treatment. The maximum length of each gastruloid is rescaled to 1 unit and the fluorescence is normalised to the maximum fluorescence from the Chi treatment. The Wnt3a condition is from a different replicate (indicated by dashed horizontal line). Vertical line in each plot marks the peak max and the corresponding coordinates denote the position of this value. (C) Statistical analysis of the indicated treatments showing the normalised root square distance as a measure of the heterogeneity for each condition within each time-point, and the indicated P values as assessed by non-paired Student's t-test. Red line indicates the median, the 25th and 75th percentiles are denoted by the bottom and top edges of the box, the whiskers extend to the most extreme data points, and outliers are indicated by the plus symbol. (D) Heat maps indicating the average fluorescence (fluorescence norm.), the average area taken up by the standard deviation (StDev Area), average length and the roundness of the gastruloids after the indicated conditions and time-points from the traces in B (Fig. S2 and Materials and Methods). (E) Live imaging of a gastruloid subjected to a pulse of DMSO (top) or Chi (bottom) between 48 and 72 h AA (n=21/condition). Gastruloid length is indicated by the y axis (posterior=0 μm), time on the x axis and the fluorescence intensity in colour. Early time-points (24-72 h AA) were imaged using a higher power objective. Scale bars: 50 μm (pre-pulse); 100 μm (post-pulse).
Fig. 4.
Fig. 4.
Gastruloids do not express genes associated with extra-embryonic tissues and progressively activate posterior markers. Quantitative RT-PCR analysis of gastruloids at 24, 48 and 72 h AA for genes associated with the epiblast, extra-embryonic tissues or those expressed in both tissues (n=∼64 gastruloids per time-point). Gastruloids display a more differentiated phenotype over time, with little detectable expression of genes associated with the extra-embryonic tissues.
Fig. 5.
Fig. 5.
Nodal signalling is absolutely required for T/Bra induction and correct patterning. (A) Gastruloids stimulated with Chi, SB43, Chi+SB43 or Nodal alone between 48 and 72 h AA (n=13, 14, 14, 14, respectively), or subjected to either vehicle or SB43 pre-treatment (24-48 h AA) prior to a Chi, Nodal or Chi+Nodal pulse (48-72 h AA; n=14 per condition). (B) Normalised fluorescence traces shown per condition with corresponding shape descriptors as heatmaps. SB43 treatment blocks the expression of T/Bra::GFP and cannot be rescued by Chi co-stimulation. Inhibition of Nodal signalling has a positive influence on axial length and elongation morphology, suggesting that Nodal modulates axial extension (see Figs S5 and S6 for further details and statistical analysis).
Fig. 6.
Fig. 6.
Wnt/β-catenin inhibition delays but does not inhibit T/Bra::GFP expression. (A,B) T/Bra::GFP gastruloids stimulated with a pulse of Chi (48-72 h AA) following pre-treatment with vehicle IWP2, XAV939, DKK or Wnt3a (n=14 per condition). Fluorescence traces (A) and heatmaps of the data (B) are shown. Blocking secretion of Wnt proteins with IWP2 effectively abolishes T/Bra::GFP expression until 96 h AA, whereby highly heterogeneous expression is observed. Interestingly, the pulse of Chi can partially rescue T/Bra::GFP expression at 72 h following XAV939 pre-treatment, indicating the requirement for Wnt protein secretion in maintenance of expression. Wnt3a pre-treatment reduces the heterogeneity of the response, better defines the pole of expression and maintains high T/Bra expression for longer than controls (see Figs S7 and S8 for further details and statistical analysis).
Fig. 7.
Fig. 7.
Wnt/β-catenin signalling between 48 and 72 h AA is essential for the correct position and expression of T/Bra. (A) Examples of the morphology and expression of T/Bra::GFP gastruloids stimulated with Chi between 24 and 72 h (top, n=14), 48 and 72 h (middle, n=14), and 48 and 96 h (bottom, n=13) AA; and (B) the corresponding fluorescence and shape-descriptor quantification. Multiple poles of expression and stunted elongations are observed when Chi is applied between 24 and 72 h AA, whereas longer later stimulation (48-96 h) results in wider gastruloids and less well defined T/Bra::GFP expression, compared with the 48-72 h control (refer to Fig. S9 for further details and statistical analysis). Scale bars: 100 μm.
Fig. 8.
Fig. 8.
BMP signalling is dispensable for early gastruloid patterning. (A) T/Bra::GFP gastruloids stimulated with Chi (48-72 h) AA following a 24 h pulse of either vehicle (top), BMP4 (middle) or DMH1 (bottom; n=12, 13 and 13 at 120 h, respectively), an inhibitor of BMP signalling between 24 and 48 h AA. Normalised fluorescence traces shown per condition (A) with corresponding fluorescence and shape descriptor quantification (B). Inhibition of BMP signalling by DMH1 or activation by BMP4 (24-48 h AA) does not alter the initial patterning of gastruloids; BMP treatment at this time has minimal effect on the subsequent patterning. (C) Gastruloids imaged at 120 h by wide-field microscopy following 24-48 h of vehicle or BMP4 stimulation (pink horizontal box) followed by either vehicle, Chi or BMP4 as indicated (blue horizontal box) between 48 and 72 h AA (n=16 per condition). (D) Stimulation schematic. BMP4 is unable to substitute for Chi in terms of the elongation and patterning of T/Bra, and its sustained expression over time (refer to Fig. S10 for further details and statistical analysis). Scale bar: 200 µm.
Fig. 9.
Fig. 9.
Tight temporal regulation of Nodal signalling is required for axial elongation and proper axial patterning. (A) Nodal−/− gastruloids pulsed with either DMSO or Chi (48-72 h AA) following a pulse of the vehicle or 100 ng/ml Nodal (24-48 h) and (B) the quantification of morphology. Four examples (i-iv) are shown for each condition. Arrows indicate protrusions. Nodal pre-stimulation suppresses protrusions; Chi stimulation enhances an elongated phenotype but does not suppress protrusions. The wild-type phenotype can be rescued if Chi-treated gastruloids have been previously exposed to Nodal. Addition of Nodal at different time-points is not able to rescue the elongations (left and Fig. S11). (C) The number of protrusions in each condition. Significance was determined using the Mann–Whitney U test with Bonferroni adjustment. (D) Immunofluorescence of Nodal−/− gastruloids treated as indicated and stained at 120 h with Hoechst (blue), for T/Bra (green) and for CDX2 (red). Nodal addition rescues axial patterning. Later addition of Nodal has less of an effect on the patterning (see Fig. S11). Scale bars: 100 μm in A; 100 μm (top) and 50 μm (bottom) in D. Sample sizes (n) are shown above C.

References

    1. Anderson K. V. (2000). Finding the genes that direct mammalian development. Trends Genet. 16, 99-102. 10.1016/S0168-9525(99)01921-6 - DOI - PubMed
    1. Andoniadou C. L. and Martinez-Barbera J. P. (2013). Developmental mechanisms directing early anterior forebrain specification in vertebrates. Cell. Mol. Life Sci. 70, 3739-3752. 10.1007/s00018-013-1269-5 - DOI - PMC - PubMed
    1. Arkell R. M., Fossat N. and Tam P. P. L. (2013). Wnt signalling in mouse gastrulation and anterior development: new players in the pathway and signal output. Curr. Opin. Genet. Dev. 23, 454-460. 10.1016/j.gde.2013.03.001 - DOI - PubMed
    1. Baillie-Johnson P., van den Brink S. C., Balayo T., Turner D. A. and Martinez Arias A. (2015). Generation of aggregates of mouse embryonic stem cells that show symmetry breaking, polarization and emergent collective behaviour in vitro. J. Vis. Exp. 105, e53252 10.3791/53252 - DOI - PMC - PubMed
    1. Bauwens C. L., Peerani R., Niebruegge S., Woodhouse K. A., Kumacheva E., Husain M. and Zandstra P. W. (2008). Control of human embryonic stem cell colony and aggregate size heterogeneity influences differentiation trajectories. Stem Cells 26, 2300-2310. 10.1634/stemcells.2008-0183 - DOI - PubMed

Publication types