. 2017 Nov 15;77(22):6400-6414.
doi: 10.1158/0008-5472.CAN-17-1612. Epub 2017 Sep 26.

Inflammatory Monocytes Promote Perineural Invasion via CCL2-Mediated Recruitment and Cathepsin B Expression

Affiliations

Inflammatory Monocytes Promote Perineural Invasion via CCL2-Mediated Recruitment and Cathepsin B Expression

Richard L Bakst et al. Cancer Res. .

Abstract

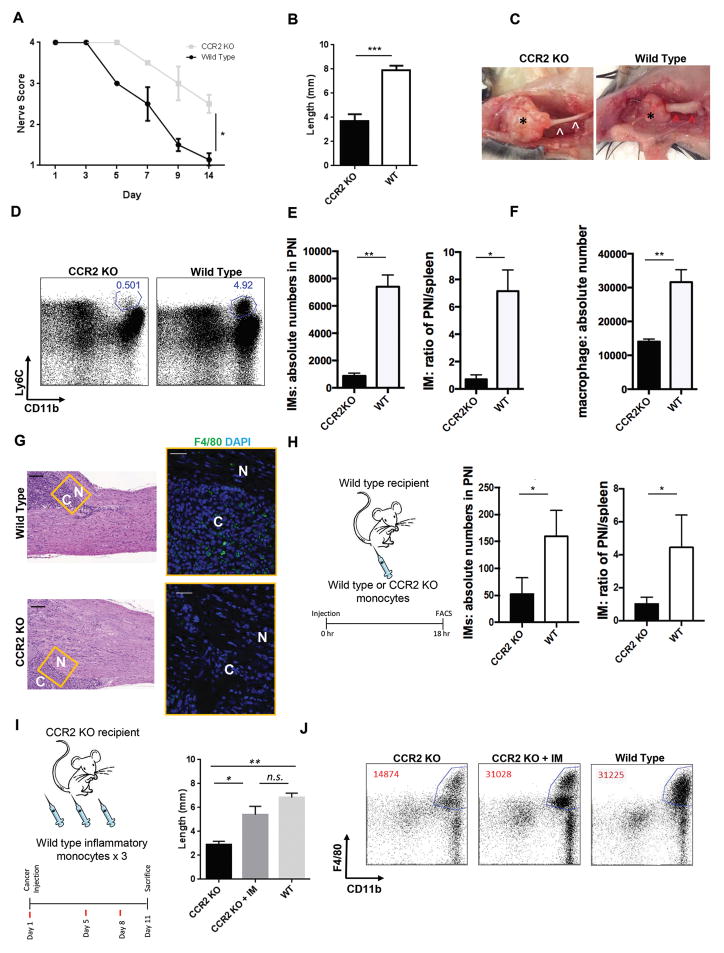
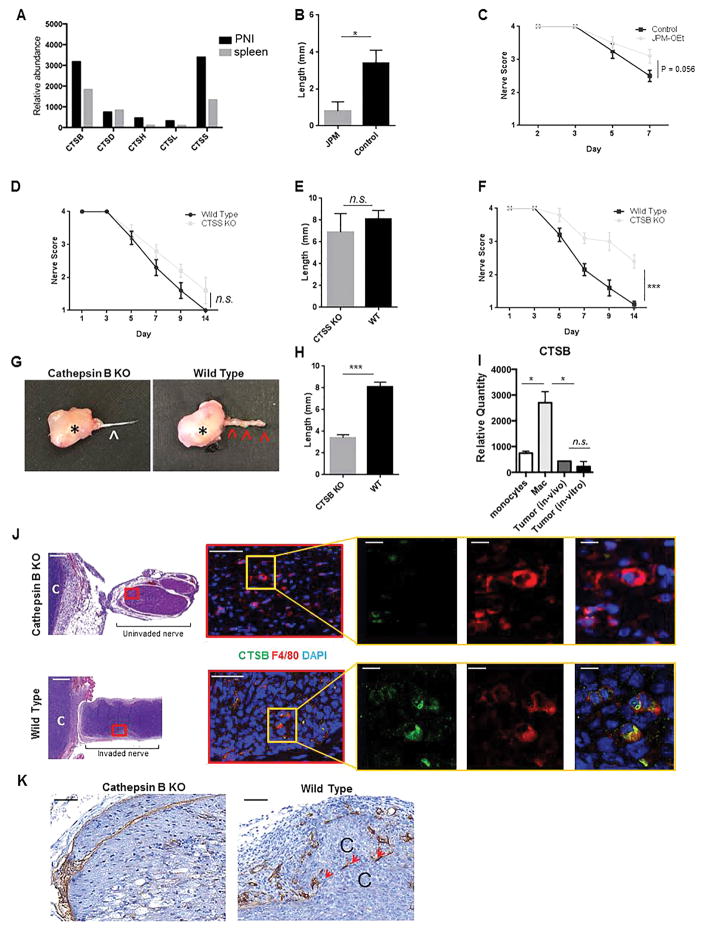
Perineural invasion (PNI) is an ominous event strongly linked to poor clinical outcome. Cells residing within peripheral nerves collaborate with cancer cells to enable PNI, but the contributing conditions within the tumor microenvironment are not well understood. Here, we show that CCR2-expressing inflammatory monocytes (IM) are preferentially recruited to sites of PNI, where they differentiate into macrophages and potentiate nerve invasion through a cathepsin B-mediated process. A series of adoptive transfer experiments with genetically engineered donors and recipients demonstrated that IM recruitment to nerves was driven by CCL2 released from Schwann cells at the site of PNI, but not CCL7, an alternate ligand for CCR2. Interruption of either CCL2-CCR2 signaling or cathepsin B function significantly impaired PNI in vivo Correlative studies in human specimens demonstrated that cathepsin B-producing macrophages were enriched in invaded nerves, which was associated with increased local tumor recurrence. These findings deepen our understanding of PNI pathogenesis and illuminate how PNI is driven in part by corruption of a nerve repair program. Further, they support the exploration of inhibiting IM recruitment and function as a targeted therapy for PNI. Cancer Res; 77(22); 6400-14. ©2017 AACR.


Conflict of interest statement

Conflict of Interest: The authors declare no potential conflicts of interest to report.

Figures

Figure 1
Figure 1. Nerves invaded by cancer recruit inflammatory monocyte-derived macrophages
A, Left, Schematic for our in-vivo model of PNI in which cancer is injected into the distal sciatic nerve and invades unidirectionally towards the spinal cord, resulting in hind limb paralysis. Right, Representative flow cytometry diagrams showing expression of Ly6C and CD11b of endogenous IM isolated from an invaded and normal murine sciatic nerve one week following cancer injection. B, Quantification of percentage of IM among CD45+ cells by flow cytometry in a murine model of PNI. Data shown as mean + s.e.m., n = 3; **, P=.003, unpaired t-test. C, Left, schematic for the adoptive transfer of green fluorescent protein positive (GFP+) IM into mice with nerve invasion. Right, Representative flow diagrams from invaded (PNI) and control nerve (PBS) specimens showing the amount of GFP+ cells isolated 18 hours after adoptive transfer of GFP+ IM. Absolute number of GFP+ cells are shown in blue. PBS, Phosphate buffered saline. D, Absolute numbers of donor IM recruited to invaded and control nerves. Data shown as mean + s.e.m., n = 3; ***, P<.001, unpaired t-test. E, Representative longitudinal (top) and cross-sectional (bottom) images of anti-GFP stained invaded nerve from (C). Inset from longitudinal image. C, indicates cancer. N, indicates nerve. Scale bar 200 μm, inset 10 μm. F, Representative flow cytometry plots showing expression of F4/80 and CD11b of transferred IM pre- and post-transfer. Macrophage differentiation (F4/80+ CD11b+) is only observed in the invaded nerve. G, Left, schematic for adoptive transfer of CD45.2 WT IM into a CD45.1 WT mouse with nerve invasion. Right, Representative flow diagram of CD45.2+ cells isolated from an invaded sciatic nerve and spleen 72 hours following adoptive transfer into CD45.1+ WT mouse. Macrophage differentiation (CD11b+ F4/80+) is only seen in the invaded nerve. H, Quantification of CD45.2+ macrophages isolated from invaded nerves and respective spleens. Data shown as mean + s.e.m., n = 3; ***, P=0.0002, unpaired t-test. I, Representative images of anti-CD163 staining in human PDA and benign pancreas. C, indicates cancer. N, indicates nerve. Scale bar 100 μm. J, Quantification of anti-CD163 staining intensity per nerve expressed as a score for PDA and benign pancreas (n = 5 in each group). Percentage of nerves positive for anti-CD163. Data shown as mean + s.e.m.. **, P=.0079, unpaired t-test.
Figure 2
Figure 2. CCR2-expressing inflammatory monocytes promote perineural invasion
A, Nerve function scores for WT and CCR2 KO mice. Data are shown as means ± s.e.m., n = 7 per group; *, P<0.05, Mann Whitney test. B, Length of invasion for the same cohort as (A). Data are shown as means + s.e.m.. ***, P<0.001, unpaired t-test. C, Representative images of gross nerve specimens from WT and CCR2 KO mice; * Indicates the primary tumor, red arrowheads indicate the adjacent thickened invaded nerve, and white arrowheads indicate a thin uninvaded nerve. D, Representative flow diagrams from CCR2 KO and WT mice showing expression of Ly6C and CD11b of endogenous IM recruited to sciatic nerves following Panc02 injection. E, Left, absolute numbers of endogenous IM isolated from CCR2 KO and WT nerve specimens. Right, relative amounts of IM normalized to the splenic population. Data are shown as means + s.e.m., n = 3 per group; *, P<0.05, **, P<0.01, unpaired t-test. F, Absolute numbers of macrophages isolated from same cohort as (E). Data are shown as means + s.e.m.. **, P<0.01, unpaired t-test. G, Representative images of anti-F4/80 staining (green) adjacent to cancer (C) invasion along the nerve (N). Black scale bar 100 μm, white scale bar 50 μm. H, Left, schematic for adoptive transfer of WT or CCR2 KO IM into WT mice with nerve invasion. Middle, absolute numbers of CCR2 KO and WT IM isolated from nerves. Right, relative amounts of IM normalized to the splenic population. Data are shown as means + s.e.m., n = 3 per group; *, P<0.05, unpaired t-test. I, Left, schematic for the sequential adoptive transfers of WT IM into CCR2 KO mice at days 1, 5, 8. Right, length of invasion for respective cohorts. Data are shown as means + s.e.m., n = 2 per group; *, P<0.05, **, P<0.01, unpaired t-test. J, Representative flow cytometry plots showing expression of F4/80 and CD11b among CD45+ cells in the sciatic nerve specimens from the respective cohorts. Cell numbers in the macrophage gate (F4/80+CD11b+) are indicated in red.
Figure 3
Figure 3. Loss of CCL2 but not CCL7 impairs PNI In Vivo.
A, Nerve function scores for WT and CCL2 KO mice. Data are shown as means ± s.e.m., n = 5 per group; *, P<0.05, Mann Whitney test. B, Length of invasion for the same cohort as (A). Data are shown as means + s.e.m.. *, P<0.05, unpaired t-test. C, Representative gross images of nerves from WT and CCL2 KO mice; * Indicates the primary tumor, red arrowheads indicate the adjacent thickened invaded nerve, and white arrowheads indicate a thin uninvaded nerve. D, Representative flow cytometry plots showing expression of Ly6C and CD11b of endogenous IM recruited to sciatic nerves following cancer injection. E, Left, absolute numbers of endogenous IM isolated from CCL2 KO and WT nerve specimens. Right, relative amounts of IM normalized to the splenic population. Data are shown as means + s.e.m., n = 5 per group; *, P<0.05, unpaired t-test. F, Absolute numbers of macrophages isolated from same cohort as (E). **, P<0.01, unpaired t-test. G, Left, schematic for the adoptive transfer of IM into WT or CCL2 KO mice following cancer injection. Middle, absolute numbers of WT or CCL2 KO IM isolated from nerves. Right, relative amounts of IM normalized to the splenic population. Data are shown as means + s.e.m., n = 4 per group; *, P<0.05, **, P<0.01, unpaired t-test. H, Nerve function scores for CCL7 KO and WT mice following cancer injection. Data are shown as means + s.e.m., n = 6 per group; P=0.24, Mann Whitney test. n.s. not significant. I, Length of invasion for the same cohort as (H). Data are shown as means + s.e.m.. P=0.10, unpaired t-test. n.s. not significant. J, Representative gross images of nerves from CCL7 KO and WT mice. * Indicates the primary tumor, red arrowheads indicate the adjacent thickened invaded nerve. K, Representative flow cytometry plots showing expression of Ly6C and CD11b of endogenous IM recruited to CCL7 KO and WT nerves following cancer injection. L, Left, absolute numbers of endogenous IM isolated from CCL7 KO and WT nerve specimens. Right, relative amounts of IM normalized to the splenic population. Data are shown as means + s.e.m., n = 6 per group; P=0.11 and 0.26 respectively. n.s. not significant. M, Absolute numbers of macrophages isolated from same cohort as (L). Data are shown as means + s.e.m.. P=0.28, unpaired t-test. n.s. not significant.
Figure 4
Figure 4. Schwann cell secreted CCL2 drives inflammatory monocyte recruitment to invaded nerves
A, Left, schematic for the adoptive transfer of WT IM into CCL2 KO or CCL7 KO following cancer injection. Middle, absolute numbers of IM isolated from CCL7 KO or CCL2 KO nerves. Right, relative amounts of IM normalized to the splenic population. Data are shown as means + s.e.m., n = 4 per group; *, P<0.05, unpaired t-test. B, CCL2 and CCL7 ELISA from CCL2 KO, CCL7 KO, and WT nerve lysates following cancer injection. Data are shown as means + s.e.m, n = 3 per group; P=0.27, unpaired t-test. B.D., below detection. n.s., not significant. C, Left, representative images of H&E staining of invaded nerves (N) in CCL2-green fluorescent protein (GFP) reporter mice. Right, the same section stained for anti-GFP demonstrating staining in regions of cancer (C) and decreased staining farther from regions of invasion in normal nerve (N). Scale bar 100 μm. D, Representative image of an invaded nerve (N) from CCL2-GFP reporter mice stained for anti-GFAP (red) and anti-GFP staining (green). Dotted line delineates upper nerve border. Scale bar 50 μm, inset 10 μm. E, Ccl2 RT-PCR performed on FACS-sorted Schwann cells (p75+) from invaded (PNI) and control nerves, Panc02 isolated from in vivo tumors and in vitro. Data are shown as means + s.e.m, n = 4, 4, 2, 2, respectively. *, P<0.05. **, P<0.01, unpaired t-test. F, Length of nerve invasion following treatment with daily anti-CCL2 antibody or control. Data are shown as means + s.e.m., n = 4 per group; *, P<0.05, unpaired t-test. G, CCL2 ELISA performed on nerve lysates for the same cohort as (F). B.D. below detection.
Figure 5
Figure 5. Macrophage derived cathepsin B promotes perineural invasion
A, RT-PCR performed on macrophages isolated from invaded in vivo nerve specimens and respective spleens for members of the cathepsin protease family. B, Length of invasion following treatment with JPM-OEt, a pan-cathepsin inhibitor. Data are shown as means + s.e.m., n = 10 per group; *, P<0.05, unpaired t-test. C, Nerve function scores for same cohort as (B). Mann Whitney test. D, Nerve function scores for WT and CTSS KO. Data are shown as means ± s.e.m., n = 5 per group; P=0.44, Mann Whitney test. n.s. not significant. E, Length of invasion for the same cohort as (D). Data are shown as means + s.e.m.. P=0.61. n.s., not significant. F, Nerve function scores for WT and CTSB KO. Data are shown as means ± s.e.m., n = 10 per group; ***, P=0.0004, Mann Whitney test. G, Representative gross images of nerves from CTSB KO and WT mice. * Indicates the primary tumor, red arrowheads indicate the adjacent thickened invaded nerve, and white arrowheads indicate a thin uninvaded nerve. H, Length of invasion for the same cohort as (G). Data are shown as means + s.e.m.. ***, P<0.001, unpaired t-test. I, Ctsb RT-PCR performed on IM, macrophages, and Panc02 isolated from in vivo nerve specimens. n = 6, 6, 2, 2, respectively; *, P< 0.05, unpaired t-test. n.s. not significant. J, Representative images of H&E stained sections of WT and CSTB KO nerves. Scale bar, 200 μm with corresponding images of adjacent sections co-stained for anti-CTSB (green) or anti-F4/80 (red). Scale bar 50 μm, insert 10 μm. K, Representative images of anti-collagen IV staining in CTSB and WT nerves specimens. Red arrowheads delineate collagen IV irregularity. C indicates cancer. Scale bar 50 μm.
Figure 6
Figure 6. Disruption of the perineurium is associated with cathepsin B expressing macrophages in human tumors
A, Frequency of macrophage infiltration by anti-CD163 staining along individual nerve foci with PNI in human PDA. B, Representative images of H&E staining of human PDA specimens with PNI with adjacent specimens stained for anti-CTSB (red) and anti-CD68 (green). Scale bar 100 μm, inset 10 μm. C, indicates cancer. N, indicates nerve. C, Co-expression analysis of individual cells from regions of PNI in human PDA specimens stained for anti-CD68 and anti-CTSB. Data are shown as means + s.e.m., n = 10 PDA specimens. ***, P<0.001, unpaired t-test. D, Representative images of normal nerves from benign pancreas and invaded nerves from PDA stained for anti-collagen IV. Scale bar 100 μm. Red arrowheads delineate the outer border of a normal nerve, comprised of collagen IV. C, indicates cancer. N, indicates nerve. E, Quantification of anti-collagen IV staining intensity. Data are shown as means + s.e.m.. n = 31 normal nerves and n = 26 invaded nerves from 10 specimens; *, P<0.05, unpaired t-test. F, Left top, representative images of anti-collagen IV stating of human PDA with PNI; left bottom, adjacent sections stained for anti-CTSB (green) and anti-CD68 (red). Right, high power image demonstrating CTSB expressing macrophages are present adjacent to regions of disrupted anti-collagen IV staining. Scale bar 50 μm, inset 25 μm. C, indicates cancer. N, indicates nerve.
Figure 7
Figure 7. Summary diagram
The data from this study support the model that in the presence of cancer, Schwann cells secrete CCL2 and recruit inflammatory monocytes (IM) from the circulation via CCR2, which facilitates tumor invasion into and along the nerve through a cathepsin B mediated disruption of the protective perineurium.

References

    1. Bapat AA, Hostetter G, Von Hoff DD, Han H. Perineural invasion and associated pain in pancreatic cancer. Nature reviews Cancer. 2011;11:695–707. - PubMed
    1. Amit M, Na’ara S, Gil Z. Mechanisms of cancer dissemination along nerves. Nature reviews Cancer. 2016;16:399–408. - PubMed
    1. Bakst RL, Wong RJ. Mechanisms of Perineural Invasion. Journal of neurological surgery Part B, Skull base. 2016;77:96–106. - PMC - PubMed
    1. Sanford DE, Belt BA, Panni RZ, Mayer A, Deshpande AD, Carpenter D, et al. Inflammatory monocyte mobilization decreases patient survival in pancreatic cancer: a role for targeting the CCL2/CCR2 axis. Clinical cancer research : an official journal of the American Association for Cancer Research. 2013;19:3404–15. - PMC - PubMed
    1. Zeng L, Guo Y, Liang J, Chen S, Peng P, Zhang Q, et al. Perineural Invasion and TAMs in Pancreatic Ductal Adenocarcinomas: Review of the Original Pathology Reports Using Immunohistochemical Enhancement and Relationships with Clinicopathological Features. Journal of Cancer. 2014;5:754–60. - PMC - PubMed

Publication types

MeSH terms