. 2017 Nov 6;7(11):3797-3808.
doi: 10.1534/g3.117.300224.

Filamentation Involves Two Overlapping, but Distinct, Programs of Filamentation in the Pathogenic Fungus Candida albicans

Affiliations

Filamentation Involves Two Overlapping, but Distinct, Programs of Filamentation in the Pathogenic Fungus Candida albicans

Jahaun Azadmanesh et al. G3 (Bethesda). .

Abstract

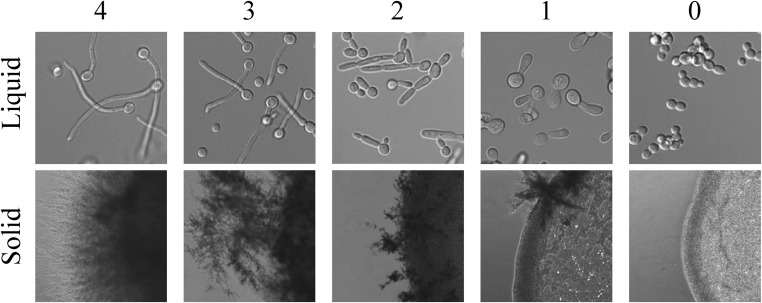
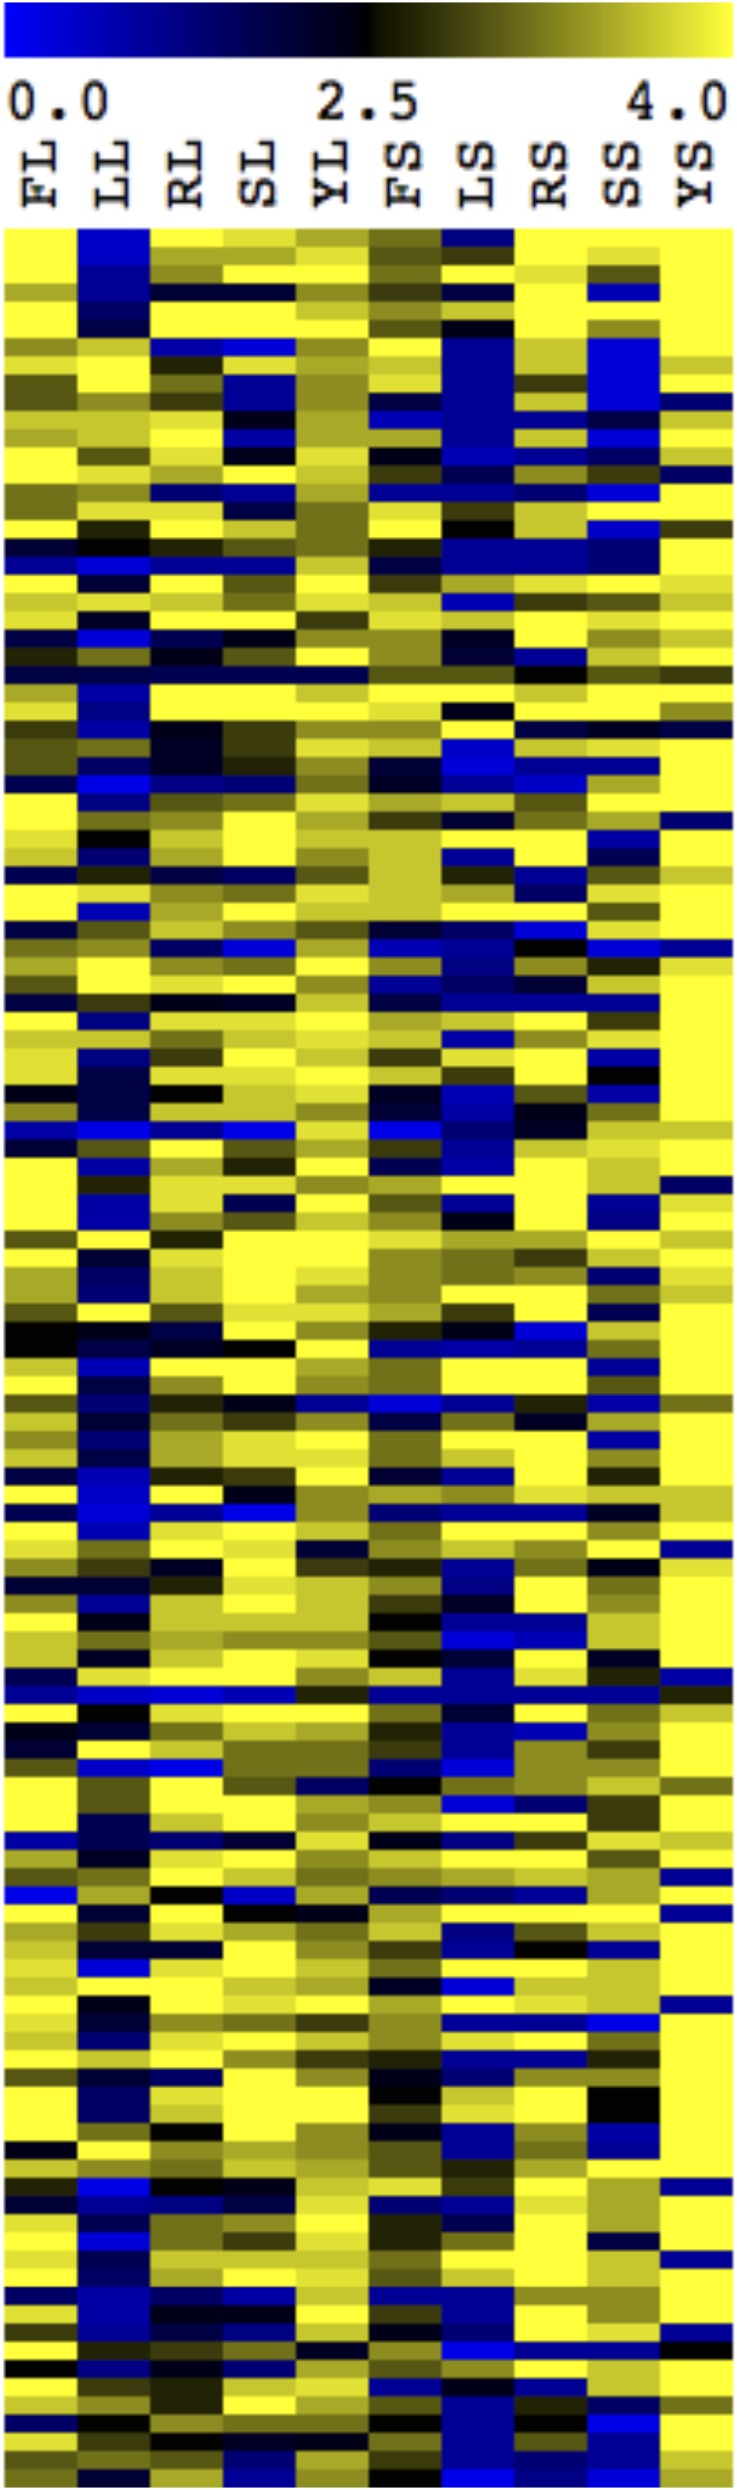
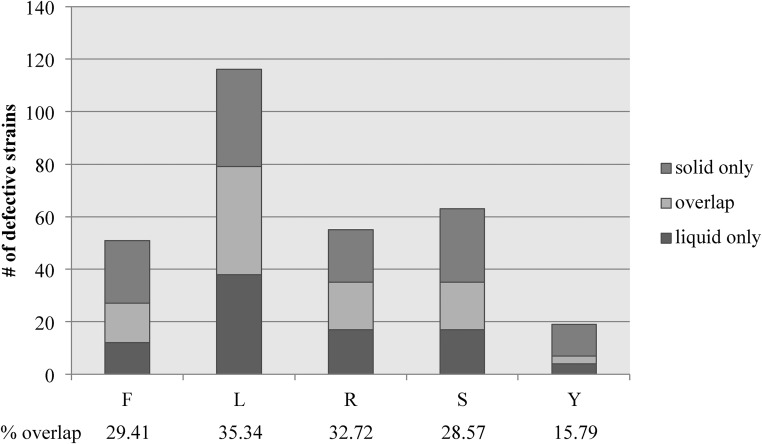
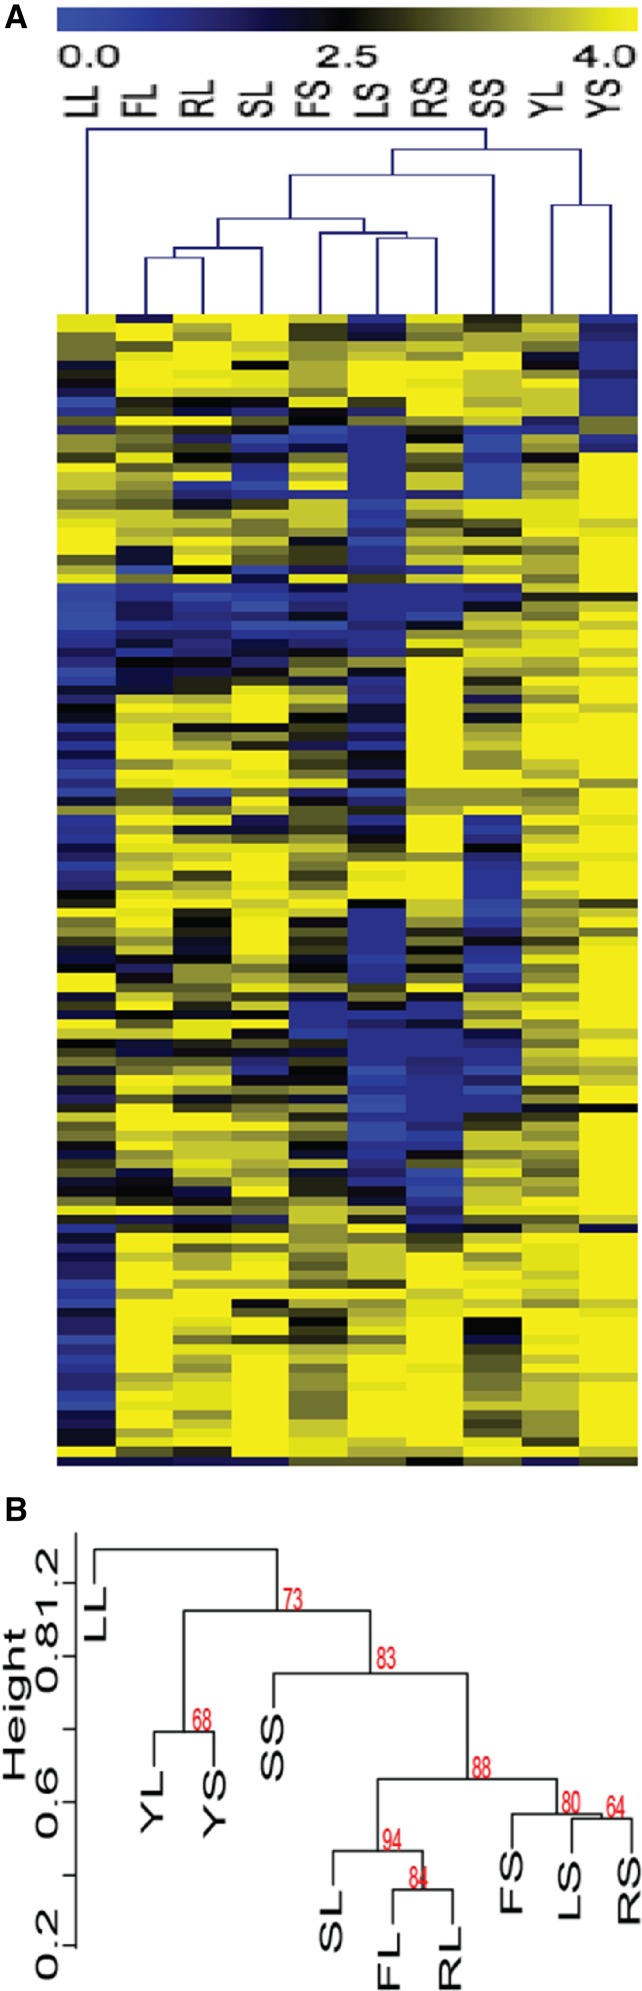
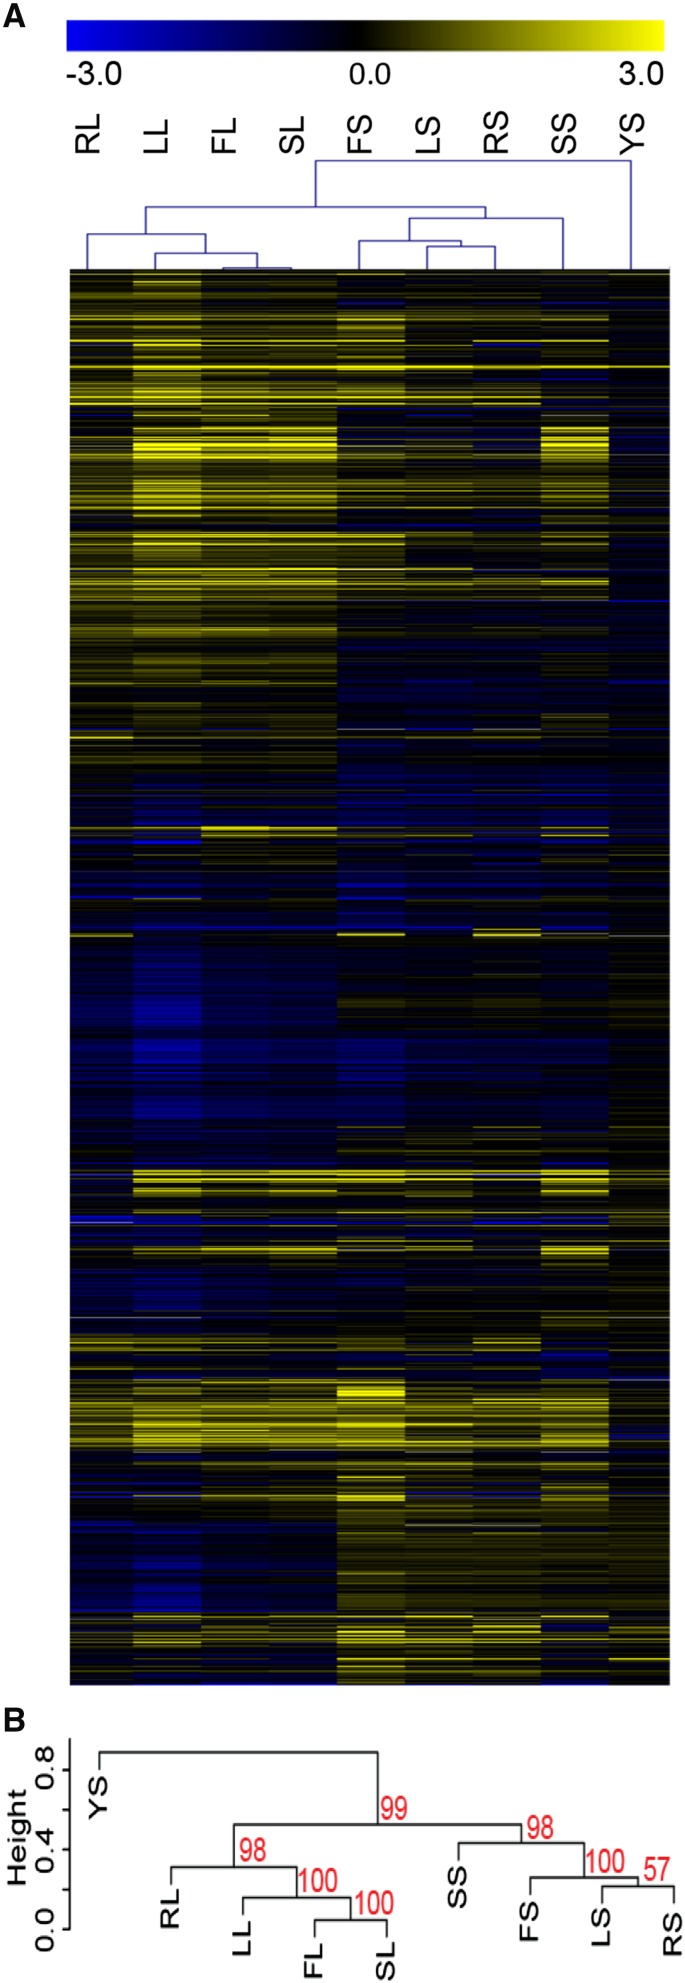
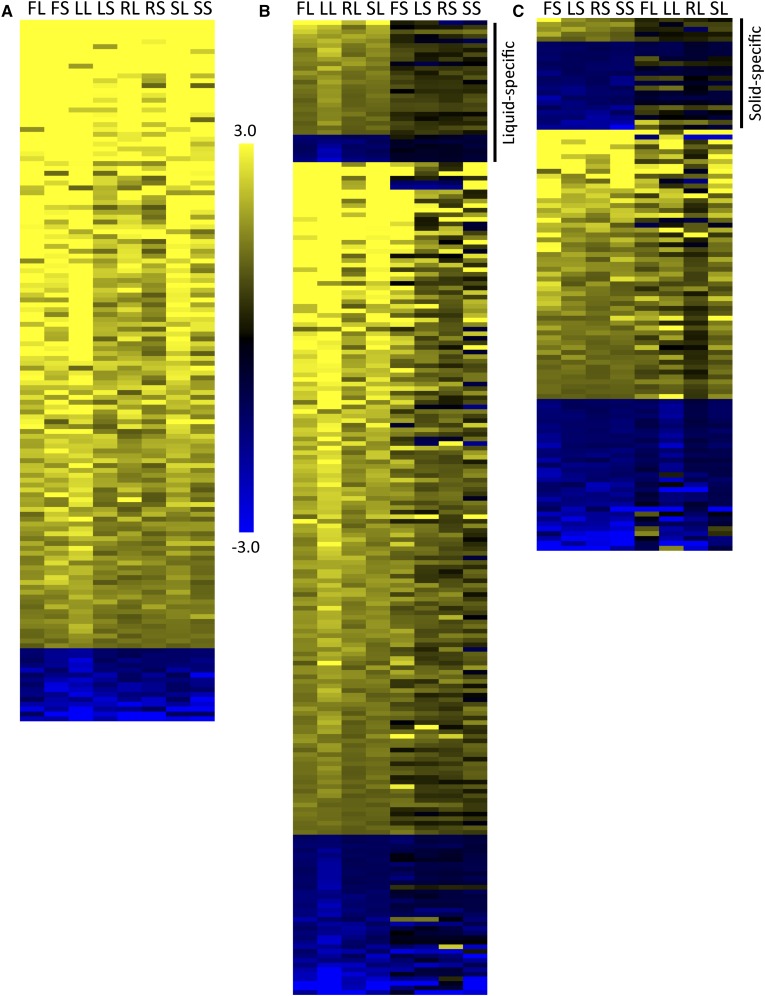
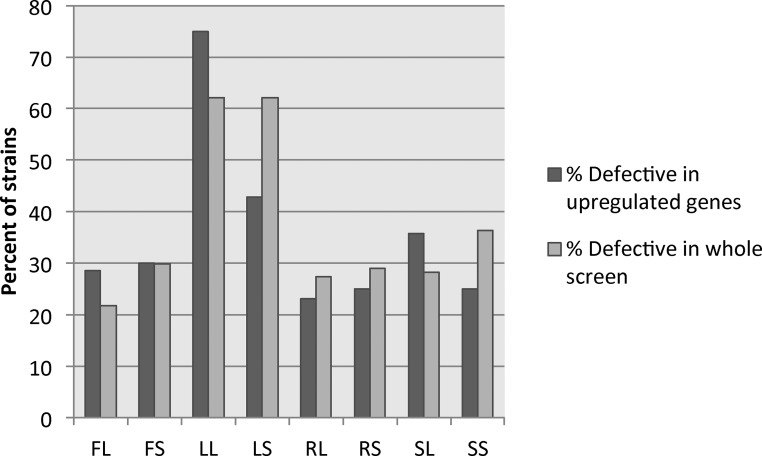
The ability of the human pathogenic fungus Candida albicans to switch between yeast-like and filamentous forms of growth has long been linked to pathogenesis. Numerous environmental conditions, including growth at high temperatures, nutrient limitation, and exposure to serum, can trigger this morphological switch and are frequently used in in vitro models to identify genes with roles in filamentation. Previous work has suggested that differences exist between the various in vitro models both in the genetic requirements for filamentation and transcriptional responses to distinct filamentation-inducing media, but these differences had not been analyzed in detail. We compared 10 in vitro models for filamentation and found broad genetic and transcriptomic differences between model systems. The comparative analysis enabled the discovery of novel media-independent genetic requirements for filamentation as well as a core filamentation transcriptional profile. Our data also suggest that the physical environment drives distinct programs of filamentation in C. albicans, which has significant implications for filamentation in vivo.

Keywords: Candida albicans; filamentation; hyphal growth; in vitro model comparisons.


Figures

Figure 1
Figure 1
Filamentation scoring range for liquid and solid filamentation conditions. C. albicans wild-type and 124 mutant strains were tested for their ability to filament in liquid and solid filamentation conditions. For both assays, cells grown overnight in YPD were centrifuged and washed 2× with PBS prior to the experiment. For the liquid assays, 10 µl of washed cells were added to a prewarmed glass-bottom microscopy dish with inducing media. Cells were imaged after 3 hr of incubation at 37° with shaking. For solid assays, 1 µl of washed cells was plated onto solid media and grown at 37° for 4–5 d before imaging. The images shown are representative images from the analysis at the respective scores for inducing conditions. The scoring range for Spider solid media is shown in Figure S7.
Figure 2
Figure 2
Mutant cells display variation in their ability to filament in distinct inducing conditions. Mutant strains were scored for their phenotype in filament-inducing and noninducing media. Strains were scored from 4 (bright yellow) representing the wild-type phenotype, to 0 (bright blue) representing a mutant phenotype in each respective media. Filament-inducing conditions included liquid or solid FBS (FL and FS, respectively), liquid or solid Lee’s (LL and LS, respectively), liquid or solid RPMI (RL or RS, respectively), and liquid or solid Spider (SL and SS, respectively). Scores of 4 (bright yellow) in these conditions represented wild-type filamentation and scores of 0 (bright blue) represented afilamentous cells. Noninducing conditions, YL and YS (liquid and solid YPD), were scored from 4 (bright yellow) representing a wild-type, nonfilamentous phenotype to 0 (bright blue) representing fully filamentous cells. The score heatmap has distinct conditions shown in columns and individual mutant strain scores in rows. Score details can be found in Table S2.
Figure 3
Figure 3
Little overlap exists between liquid and solid filamentation defects. The total number of strains exhibiting a filamentous defect in FBS (F), Lee’s (L), RPMI (R), and Spider (S) liquid and solid media is represented by the total height of the bar for each condition. The number of strains showing defects in both liquid and solid versions of the same media is represented by the light colored section of each bar. The number of strains with solid only (medium gray) and liquid only (dark gray) are also represented on each bar. The percentage of strains exhibiting a defect in both conditions compared to the total number or strains exhibiting a defect in at least one condition is shown below each bar.
Figure 4
Figure 4
Clustering analysis of filamentation data shows a difference between filamentation in solid and liquid conditions. Hierarchical clustering analysis of the data in Figure 2 and Table S3 identified conditions with similar suites of mutant strains that exhibit filamentation defects. (A). A heat map showing relatedness of phenotypes between strains in each condition. Blue represents strains with phenotypic defects and yellow represents strains with phenotypes close to wild type in each condition. Conditions labels, across the top of the heat map, are the same as those used in Figure 2. Mutant strain phenotype of each of the 124 mutant strains tested is shown across each row. (B). The dendrogram of the hierarchical phenotypic clustering. Approximately unbiased (AU) P-values for each cluster are shown in red.
Figure 5
Figure 5
Clustering analysis of gene expression data shows a liquid/solid divide in gene expression. Hierarchical clustering was used to compare the expression of genes in distinct filamentation and control conditions. (A). Clustering revealed related gene regulation between conditions, as shown by the tree at the top of the heatmap. Gene expression was log2 transformed prior to clustering. Full details of the expression study are in Table S4. (B). A dendrogram of the hierarchical expression clustering. Approximately unbiased (AU) P-values for each cluster are shown in red.
Figure 6
Figure 6
Gene expression analysis in filamentous conditions identifies three patterns of gene expression. Gene expression was measured by RNAseq analysis in each inducing and noninducing condition in triplicate with the YPD liquid used as the normalizing condition. The heat maps represent the average expression of genes in each condition, using the same labels shown in Figure 1. Expression in each condition was normalized by comparing FPKM values for each gene to the FPKM value of that gene in YPD liquid conditions. All data shown have been log2 transformed. (A) One hundred forty-four genes showed similar regulation patterns, with 129 genes upregulated and 15 genes downregulated, across all conditions. (B) Three hundred fifty-seven genes showed similar regulation patterns across all liquid conditions. The genes shown are those with liquid-specific profiles, indicated by the bar on the right, and genes with similar expression patterns in at least one solid condition. (C) Two hundred fifty-three genes showed similar regulation patterns across all solid conditions. The genes shown are those with solid-specific profiles, indicated by the bar on the right, and genes with similar expression patterns in at least one liquid condition. The genes similarly regulated in all conditions were not included in B and C. Gene identifications and expression levels are shown in Table S5. Data for the full set can be found in Table S2.
Figure 7
Figure 7
Gene upregulation is not linked to phenotypic defects in coordinate conditions. The expression of genes represented in the mutant collection were compared to the mutant phenotype of the respective deletion strain in each condition. For each condition, the number of strains with a severe phenotypic defect and upregulation of the respective gene were compared to the total number of strains exhibiting a defect in that condition to calculate the percentage defective in upregulated genes (dark gray bars). This is compared to the percentage of strains showing a phenotypic defect in each condition (light gray bars).

References

    1. Akashi T., Kanbe T., Tanaka K., 1994. The role of the cytoskeleton in the polarized growth of the germ tube in Candida albicans. Microbiology 140: 271–280. - PubMed
    1. Banerjee M., Thompson D. S., Lazzell A., Carlisle P. L., Pierce C., et al. , 2008. UME6, a novel filament-specific regulator of Candida albicans hyphal extension and virulence. Mol. Biol. Cell 19: 1354–1365. - PMC - PubMed
    1. Blankenship J. R., Fanning S., Hamaker J. J., Mitchell A. P., 2010. An extensive circuitry for cell wall regulation in Candida albicans. PLoS Pathog. 6: e1000752. - PMC - PubMed
    1. Bockmuhl D. P., Krishnamurthy S., Gerads M., Sonneborn A., Ernst J. F., 2001. Distinct and redundant roles of the two protein kinase A isoforms Tpk1p and Tpk2p in morphogenesis and growth of Candida albicans. Mol. Microbiol. 42: 1243–1257. - PubMed
    1. Cali B. M., Doyle T. C., Botstein D., Fink G. R., 1998. Multiple functions for actin during filamentous growth of Saccharomyces cerevisiae. Mol. Biol. Cell 9: 1873–1889. - PMC - PubMed

MeSH terms