Review
. 2017 Sep 26;13(9):942.
doi: 10.15252/msb.20156297.

Revisiting biomarker discovery by plasma proteomics

Affiliations
Review

Revisiting biomarker discovery by plasma proteomics

Philipp E Geyer et al. Mol Syst Biol. .

Abstract

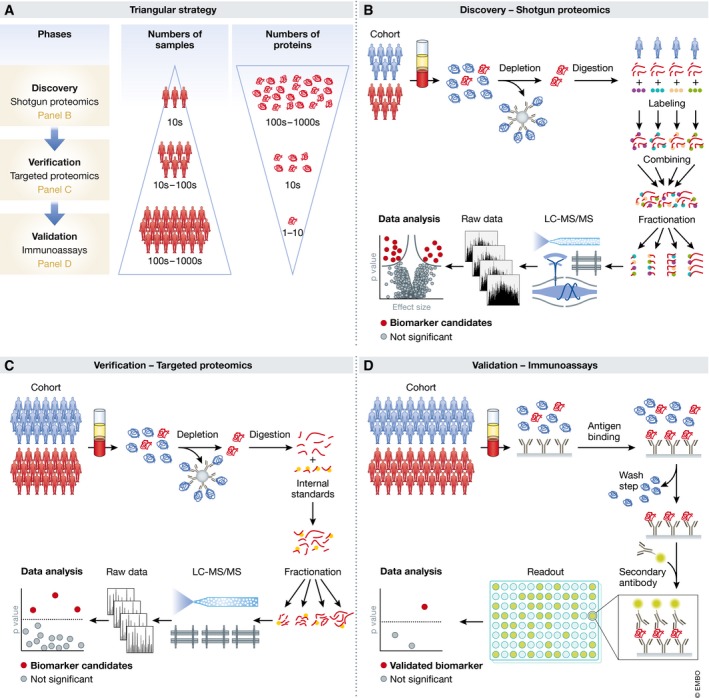
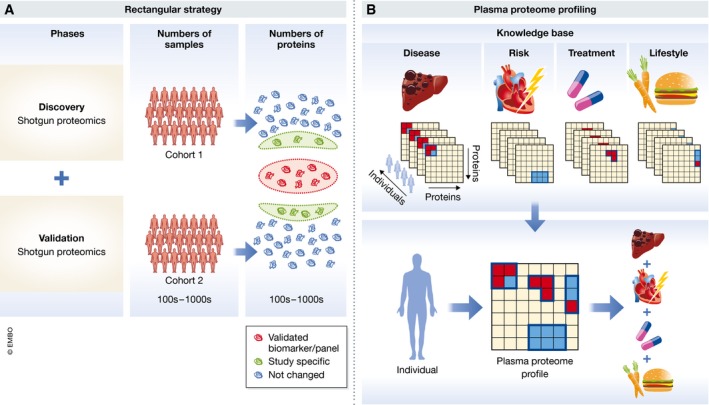
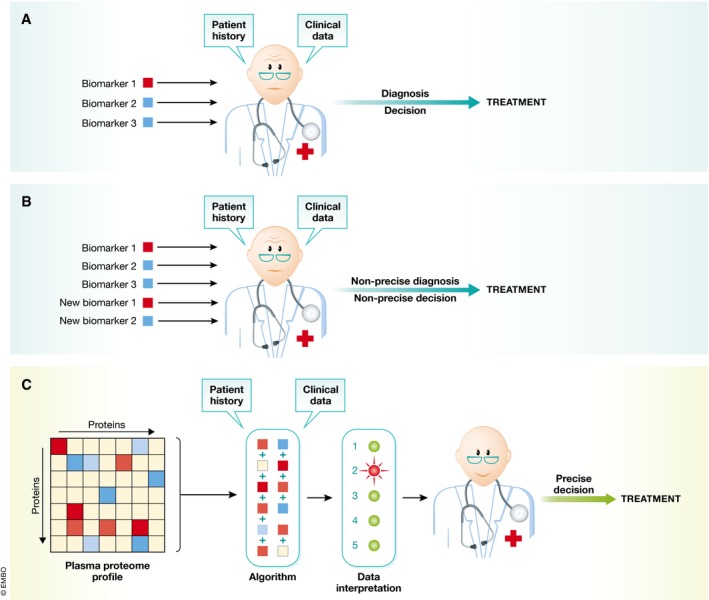
Clinical analysis of blood is the most widespread diagnostic procedure in medicine, and blood biomarkers are used to categorize patients and to support treatment decisions. However, existing biomarkers are far from comprehensive and often lack specificity and new ones are being developed at a very slow rate. As described in this review, mass spectrometry (MS)-based proteomics has become a powerful technology in biological research and it is now poised to allow the characterization of the plasma proteome in great depth. Previous "triangular strategies" aimed at discovering single biomarker candidates in small cohorts, followed by classical immunoassays in much larger validation cohorts. We propose a "rectangular" plasma proteome profiling strategy, in which the proteome patterns of large cohorts are correlated with their phenotypes in health and disease. Translating such concepts into clinical practice will require restructuring several aspects of diagnostic decision-making, and we discuss some first steps in this direction.

Keywords: biomarkers; diagnostic; mass spectrometry; plasma proteomics; systems medicine.


Figures

Figure 1
Figure 1. Blood‐based laboratory testing in a clinical setting
(A) Concentration range of plasma proteins with the gene names of several illustrative blood proteins (red dots). Concentrations are in serum or plasma and measured with diverse methods as retrieved from the plasma proteome database in May 2017 (http://www.plasmaproteomedatabase.org/) (Nanjappa et al, 2014). (B) Bioinformatic keyword annotation of the plasma proteome database. The blue boxplots with the 10–90% whiskers visualize the range of diverse proteins contributing to distinct functions. (C) Percentage of inpatient admissions receiving blood‐based laboratory testing. Numbers are based on 9 million tests performed in the year 2016 at the Institute of Laboratory Medicine, University Hospital Munich. (D) Percentage of outpatient admissions receiving blood‐based laboratory testing. (E) Distribution of laboratory tests based on frequency of request. Examples of test for different classes of analytes are as follows: Proteins and enzymes—liver enzymes, inflammatory proteins, tumor markers; Small molecules—electrolytes, substrates, vitamins; Cells—red, white blood cells, and platelets; Drugs—immunosuppressants, antibiotics, and drugs of abuse; Specific antibodies—autoantibodies and antibodies against infectious agents; and Nucleic acids—viruses and genetic variants.
Figure 2
Figure 2. Comprehensive literature review
(A) Publications using MS‐based proteomics in plasma biomarker research (red) compared to the total number of publications in proteomics (blue). (B) Pie charts about the intentions of the investigated studies and proportions of investigated diseases. (C) Overview of the percentage of studies, using discovery and validation phases. (D) Studies using pooled samples, depletion, fractionation, and multiplexing in plasma biomarker research using MS‐based proteomics.
Figure 3
Figure 3. Current paradigms in plasma biomarker research (“triangular approach”)
(A) A relatively small number of cases and controls are analyzed by hypothesis‐free discovery proteomics in great depth, ideally leading to the quantification of thousands of proteins (top layer in the panel). This may yield tens of candidates with differential expression that are screened by targeted proteomics methods in cohorts of moderate size (middle layer). Finally, for one or a few of the remaining candidates, immunoassays are developed, which are then validates in large cohorts and applied in the clinic (bottom layer). (B) Workflow for hypothesis‐free discovery proteomics. (C) Targeted proteomics for candidate verification. (D) Development of immunoassays for clinical validation and application.
Figure 4
Figure 4. Rectangular workflow
(A) A large cohort is investigated in the discovery phase with as much proteome coverage as possible. In the validation phase, another cohort is analyzed to confirm the biomarker candidates, but it uses the same technology and similar cohort size. Both cohorts can be analyzed in parallel, but only the proteins that are statistically significantly different in both studies (orange as opposed to green circle in the right‐hand part of panel A) are validated biomarkers. (B) Plasma proteome profiling of diverse lifestyle, disease, treatment, or other relevant alterations will over time build up a knowledge base that connects plasma protein changes to perturbations in a general manner (upper panel). The plasma proteome profile of a given individual can then be deconvoluted using the information and algorithms associated with the knowledge base (lower panel).
Figure 5
Figure 5. Biomarker distribution across the abundance range
The blue area illustrates the percentage of biomarker (BM) as a function of increasing depth of the plasma proteome. Within the 300 most abundant proteins, 23% are already known biomarkers. The top of the yellow region extrapolates this proportion to the remainder of the plasma proteome. If the portion of biomarkers remained as high as it is in the 300 most abundant proteins, there are at least 233 potential biomarkers to be discovered (yellow area of the figure).
Figure 6
Figure 6. Implementation of proteomic data in clinical decisions
(A) Currently, physicians make treatment decisions on the basis of a few plasma biomarker tests, combined with patient history and clinical data (upper panel). (B) Adding new biomarkers would quickly overwhelm the current paradigm—leading to suboptimal clinical decisions. (C) Multi‐protein panels and the data from past studies (the knowledge base in Fig 4B) are combined algorithmically. This will aid the physician in making more precise recommendations for treatment, while still taking patient history and other clinical data into account.

References

    1. Abbatiello SE, Schilling B, Mani DR, Zimmerman LJ, Hall SC, MacLean B, Albertolle M, Allen S, Burgess M, Cusack MP, Gosh M, Hedrick V, Held JM, Inerowicz HD, Jackson A, Keshishian H, Kinsinger CR, Lyssand J, Makowski L, Mesri M et al (2015) Large‐scale interlaboratory study to develop, analytically validate and apply highly multiplexed, quantitative peptide assays to measure cancer‐relevant proteins in plasma. Mol Cell Proteomics 14: 2357–2374 - PMC - PubMed
    1. Addona TA, Abbatiello SE, Schilling B, Skates SJ, Mani DR, Bunk DM, Spiegelman CH, Zimmerman LJ, Ham AJ, Keshishian H, Hall SC, Allen S, Blackman RK, Borchers CH, Buck C, Cardasis HL, Cusack MP, Dodder NG, Gibson BW, Held JM et al (2009) Multi‐site assessment of the precision and reproducibility of multiple reaction monitoring‐based measurements of proteins in plasma. Nat Biotechnol 27: 633–641 - PMC - PubMed
    1. Aebersold R, Mann M (2016) Mass‐spectrometric exploration of proteome structure and function. Nature 537: 347–355 - PubMed
    1. Altelaar AF, Heck AJ (2012) Trends in ultrasensitive proteomics. Curr Opin Chem Biol 16: 206–213 - PubMed
    1. Anderson NL, Anderson NG, Haines LR, Hardie DB, Olafson RW, Pearson TW (2004) Mass spectrometric quantitation of peptides and proteins using Stable Isotope Standards and Capture by Anti‐Peptide Antibodies (SISCAPA). J Proteome Res 3: 235–244 - PubMed

Publication types