. 2017 Sep 26;8(1):700.
doi: 10.1038/s41467-017-00823-x.

A surface-stabilized ozonide triggers bromide oxidation at the aqueous solution-vapour interface

Affiliations

A surface-stabilized ozonide triggers bromide oxidation at the aqueous solution-vapour interface

Luca Artiglia et al. Nat Commun. .

Abstract

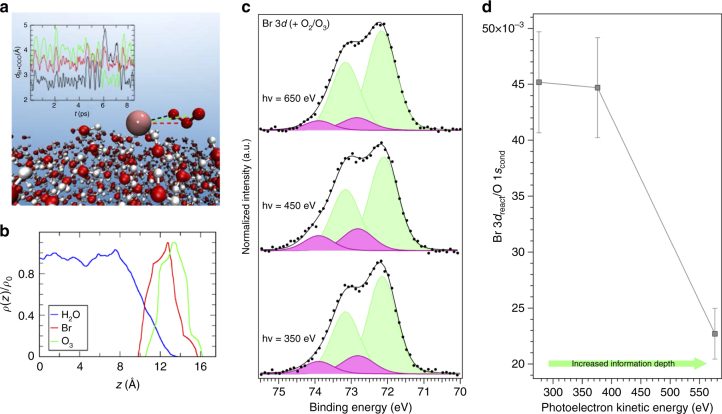
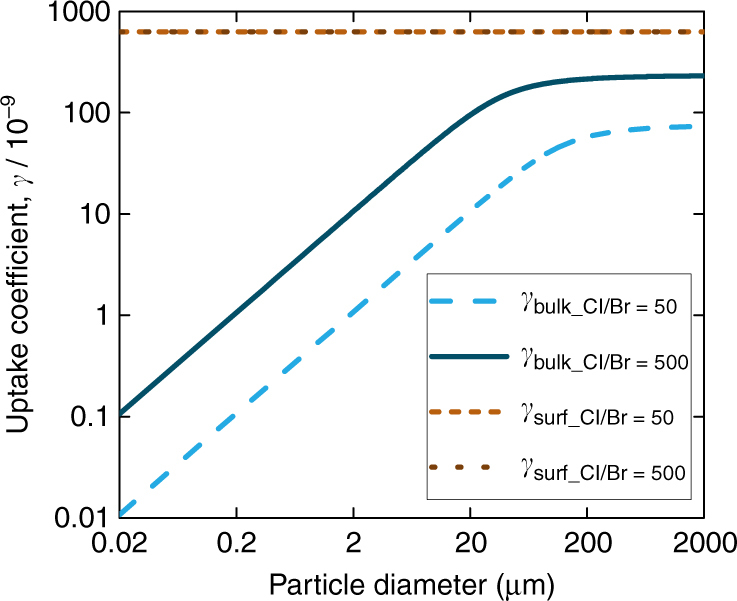
Oxidation of bromide in aqueous environments initiates the formation of molecular halogen compounds, which is important for the global tropospheric ozone budget. In the aqueous bulk, oxidation of bromide by ozone involves a [Br•OOO-] complex as intermediate. Here we report liquid jet X-ray photoelectron spectroscopy measurements that provide direct experimental evidence for the ozonide and establish its propensity for the solution-vapour interface. Theoretical calculations support these findings, showing that water stabilizes the ozonide and lowers the energy of the transition state at neutral pH. Kinetic experiments confirm the dominance of the heterogeneous oxidation route established by this precursor at low, atmospherically relevant ozone concentrations. Taken together, our results provide a strong case of different reaction kinetics and mechanisms of reactions occurring at the aqueous phase-vapour interface compared with the bulk aqueous phase.Heterogeneous oxidation of bromide in atmospheric aqueous environments has long been suspected to be accelerated at the interface between aqueous solution and air. Here, the authors provide spectroscopic, kinetic and theoretical evidence for a rate limiting, surface active ozonide formed at the interface.


Conflict of interest statement

The authors declare no competing financial interests.

Figures

Fig. 1
Fig. 1
Heterogeneous kinetics results. Measured uptake coefficients of ozone, γ obs, at different ozone concentrations (symbols) on aqueous bromide solutions, along with calculated uptake coefficients (lines) from a parameterized fit to several measured datasets, explained in Supplementary Notes 1 and 2. The uptake coefficient is the loss rate of gas phase ozone to the aqueous solution normalized to the gas kinetic collision rate with the aqueous solution surface. In plot a, data from experiments performed with solutions of varying bromide content are shown for four different ozone concentrations in the gas phase, while in plot b, data result from experiments, in which the ozone concentration was varied, for two different bromide concentrations in the aqueous phase. Error bars represent s.d. of measured values
Fig. 2
Fig. 2
Energetic profile for the bromide-ozone reaction with water molecules. The figure reports the energetic profile for the reaction of bromide with ozone in a cluster consisting of four water along the singlet (blue) and triplet (red) surface. Electronic structure calculations were performed at CCSD(T)/6–311++G(df,p)//MP2/6–311++G(df,p) level. All energies, which include the Zero Point Energy (ZPE) correction, are relative to the singlet reactants and are reported in kJ mol−1. The spin crossing between the two potential energy surfaces is highlighted by the intersection of the red and blue arrows between the pre-reaction complexes and the transition states
Fig. 3
Fig. 3
Photoemission spectra of the Br 3d peak acquired in situ. a Picture of the liquid microjet assembly, equipped with the gas dosing system, during operation; b Superimposition of the Br 3d photoemission spectra, normalized to the maximum, acquired before dosing (red), while dosing oxygen (blue), and while dosing a mixture of 1% ozone in oxygen; c deconvolution of the raw spectra in plot b, performed using Gaussian peaks after subtraction of a Shirley background; d comparison of the Br 3d photoemission spectra acquired while dosing a mixture of 1% ozone in oxygen with two reference spectra of hypobromite and bromate
Fig. 4
Fig. 4
Surface propensity of [Br•OOO]. a Snapshot from the first-principle MD trajectory demonstrating the stability of [Br•OOO] on the surface of liquid water. The inset shows the distances between the bromine and each of the oxygen atoms in the ozone molecule recorded during the 8.5 ps MD trajectory. b From the same trajectory, the bromide and ozone density profile showing the position of the centre of mass of these two groups along the coordinate perpendicular to the interface. In blue, the water profile as reference in arbitrary units. c deconvolution of the Br 3d photoemission spectra (performed using Gaussian peaks after subtraction of a Shirley background), normalized to the area, acquired at hν = 350, 450, and 650 eV, and corresponding to photoelectron kinetic energies of 276, 376 and 575 eV (Br 3d region centroid). d Plot of the intensity of the Br 3d peaks associated to the [Br•OOO] complex normalized to the O 1 s (peak acquired with second order light) from the condensed phase (Supplementary Note 4), as a function of the photoelectron kinetic energy. The error bars were calculated by propagating the errors associated with each peak area of three independent measurements
Fig. 5
Fig. 5
Implications for ozone uptake under atmospheric conditions. Predicted uptake coefficient for bulk reaction only (blue lines) and uptake coefficient due to surface reaction only (brown lines) for deliquesced sea salt solution equilibrated at 80% relative humidity (4.0 M Cl) and a chloride to bromide ratio of 50 (light blue and light brown lines) and 500 (dark blue and dark brown)), as a function of the diameter of a spherical brine droplet or aerosol particle. The brown lines overlap, because the surface coverage of the bromide ozonide complex, and thus also the surface reaction rate, does not depend on the bromide concentration in the aqueous phase within the relevant range. This plot emphasizes the predominance of a surface process, especially for smaller particle sizes

References

    1. Oum KW, Lakin MJ, Finlayson-Pitts BJ. Bromine activation in the troposphere by the dark reaction of O-3 with seawater ice. Geophys. Res. Lett. 1998;25:3923–3926. doi: 10.1029/1998GL900078. - DOI
    1. De Haan DO, et al. Heterogeneous chemistry in the troposphere: experimental approaches and applications to the chemistry of sea salt particles. Int. Rev. Phys. Chem. 1999;18:343–385. doi: 10.1080/014423599229910. - DOI
    1. Raso, A. R. W. et al. Active molecular iodine photochemistry in the Arctic. Proc. Natl Acad. Sci. USA, doi: 10.1073/pnas.1702803114. - PMC - PubMed
    1. Parrella JP, et al. Tropospheric bromine chemistry: implications for present and pre-industrial ozone and mercury. Atmos. Chem. Phys. 2012;12:6723–6740. doi: 10.5194/acp-12-6723-2012. - DOI
    1. Schmidt JA, et al. Modeling the observed tropospheric BrO background: Importance of multiphase chemistry and implications for ozone, OH, and mercury. J. Geophys. Res. 2016;121:11819–11835.

Publication types

LinkOut - more resources