. 2017 Sep 26;7(1):12319.
doi: 10.1038/s41598-017-12468-3.

High-Affinity Functional Fluorescent Ligands for Human β-Adrenoceptors

Affiliations

High-Affinity Functional Fluorescent Ligands for Human β-Adrenoceptors

Gyuzel Y Mitronova et al. Sci Rep. .

Abstract

Visualization of the G-protein coupled receptor (GPCR) is of great importance for studying its function in a native cell. We have synthesized a series of red-emitting fluorescent probes targeting β-adrenergic receptor (βAR) that are compatible with confocal and Stimulated Emission Depletion (STED) microscopy as well as with Time-Resolved Fluorescence Resonance Energy Transfer (TR-FRET) binding assay in living cells. The probe based on the agonist BI-167107 and fluorescent dye KK114 demonstrates nanomolar binding affinity and up to nine-fold β2AR selectivity over β1AR. Carazolol-derived probes are fluorogenic and allow no-wash imaging experiments. STED microscopy of β2ARs stained at the native expression level on pancreatic CAPAN cells provides two-fold improvement in lateral optical resolution over confocal mode and reveals the formation of receptor microdomains. These probes retain their functional (agonist or antagonist) properties, allowing simultaneous modulation of cyclic adenosine monophosphate (cAMP) levels and receptor internalization as well as imaging receptor localization.


Conflict of interest statement

The authors declare that they have no competing interests.

Figures
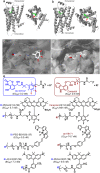
Figure 1
Figure 1
β2AR binding sites and chemical structures of fluorescent derivatives of BI-167107 and carazolol. (a,b) Side view and extracellular view of (R)-enantiomer BI-167107 (a, PDB ID code 4LDE) and (S)-carazolol (b, PDB ID code 5JQH) ligands (green) bound to the β2AR (gray). T4 lysozyme and nanobody are omitted for clarity. (c,d) Magnified view of BI-167107 (c) and carazolol (d) within the binding pocket of the receptor. (e) Chemical structures of fluorescent derivatives of BI-167107 (with EC50 values) and carazolol (with IC50 values). Red arrows indicate positions suitable for attachment of fluorescent reporters.
Figure 2
Figure 2
Synthesis of fluorescent ligands comprising BI-167107 (a) and carazolol (b) fragments. Reagents and conditions: (a) (1) SOCl2, reflux, 2 h; (2) CH2N2, Et3N, Et2O, 0 °C to rt, 3 h; (3) C6H5CO2Ag, Et3N, MeOH, ultrasound, 8 °C, 10 min; (4) MeMgBr, Et2O, 0 °C to rt, 3 h; (5) ClCH2CN, H2SO4, AcOH, 0 °C, 1 h; (6) thiourea, AcOH, EtOH, reflux, overnight; (7) Boc2O, NaHMDS, −20 °C to rt, THF, 1 h; (8) bis(neopentyl glycolato)diboron, Pd(dppf)Cl2, KOAc, dioxane, 110 °C, 4 h; (9) trans-BrCH = CHCO2Et, Pd(dba)2, SPhos, K3PO4, n-BuOH, 100 °C, 20 h; (10) TFA, DCM, 0 °C to rt, 16 h; (11) EtOH, 70 °C, 15 min; (12) NaBH4, EtOH/THF, 0 °C to rt, 1 h; (13) 10% Pd/C, H2, EtOH/MeOH, rt, overnight; (14) NaOH, EtOH/H2O, 0 °C to rt, 3 h; (15) H2N(CH2)4NHCbz or H2N-PEG2-(CH2)2NHCbz, PyBOP, DIEA, DMSO or DMF, rt, 1 h; (16) 10% Pd/C, H2, THF, rt, 24 h; (17) dye-NHS ester, Et3N, DMF, rt, 1 h. (b) (1) BocNH(CH2)2C(CH3)2NH2, EtOH, 90 °C, 4 h; (2) 4 M HCl in dioxane, EtOAc, rt, 1 h; (3) Boc-NH-PEG4-(CH2)2COOH, HATU, Et3N, DMSO, rt, 1 h; (4) TFA, DCM, rt, overnight; (5) dye-NHS ester, Et3N, DMF, rt, 1 h. PEG = -(CH2)2O-.
Figure 3
Figure 3
Determination of K d app and cellular cAMP changes induced by βAR fluorescent ligands. (a) Schematic representation of the fluorescent cAMP biosensor TEpacVV mechanism of action. Basal cAMP level is present in the unstimulated cells resulting in a low mTurqouise (CFP) emission and large FRET signal. Addition of the agonist leads to production of cAMP, increase of CFP emission and decrease in FRET efficiency. (b) Intracellular cAMP sensor response; red line – the dose response curve of BI-PEG-KK114 (18) in HEK 293 expressing 3′,5′-cAMP FRET sensor cells. The cells were treated with increasing concentrations of BI-PEG-KK114 (18); blue line –displacement of isoprenaline with carazolol-KK114 (24) in HEK293 cells expressing biosensor TEpacVV. The cells were treated with 17 nM isoprenaline and increasing concentrations of carazolol-KK114 (24). Sensor response R(CFP/FRET) was normalized to the R(CFP/FRET) of DMSO sample. All data correspond to 30 min incubation time; the estimated IC50 of carazolol-KK114 (24) from this experiment is 444 ± 79 nM. Data points are mean ± SD, n = 3 independent experiments. (c) Schematic representation of receptor-ligand saturation binding assay performed with Tag-lite (Cisbio) β1AR or β2AR Lumi4-Tb cryptate-labeled transfected cells with detection by Time-Resolved Fluorescence Energy Transfer (TR-FRET). (d) K d app values of fluorescent ligands BI-PEG-KK114 (18) and carazolol-KK114 (24) obtained in TR-FRET assay. The cells were treated with fluorescent ligand and incubated for 2 h at room temperature before readout. Data points are mean ± SD, n = 4 independent experiments.
Figure 4
Figure 4
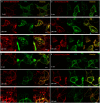
Confocal images of living U2OS cells expressing the β2AR-YFP fusion protein stained with fluorescent ligands. Cells were incubated for 40 min at room temperature in the presence of 5 nM, 100 nM or 250 nM of either: (a) BI-PEG-BDY630 (17), (b) BI-PEG-KK114 (18) (c) ab118171 or (d) carazolol-KK114 (24) in growth medium and washed two times before imaging. Images were obtained on a Leica SP8 microscope using identical settings for each fluorescent ligand as described in the Methods section. The individual color channels and their overlay images are shown. Scale bars 10 µm.
Figure 5
Figure 5
Competitive displacement of BI-PEG-KK114 (18) βAR fluorescent probe with non-fluorescent BI-167107 ligand. Living U2OS cells expressing β2AR-YFP fusion protein were incubated for 30 min with a mixture of 100 nM BI-PEG-KK114 (18) and 10 µM BI-167107 in growth medium in presence of 0.1 µg/ml Hoechst 33342 and washed two times before imaging on a Leica SP8 microscope. The individual color channels and their overlay images are shown. Scale bars 50 µm.
Figure 6
Figure 6
Fluorogenic behavior of the βAR fluorescent probes. (a) Fluorescence increase upon addition of sodium dodecyl sulfate (SDS). SDS was added to solutions of the probes in PBS containing 1 mg/ml BSA to 0.1% final concentration. The spectra are averaged from three independent experiments and normalized to FBSA+SDS at fluorescence emission maximum. The bars represent the calculated ratios FBSA+SDS/FBSA of fluorescence emission intensities at 635 nm for 610CP, 645 nm for BODIPY 630/650-X and 655 nm for KK114 conjugates. Fluorescence increase is presented as a mean ± SD, n ≥ 3 independent experiments. (b) Absorption and emission spectra of KK114-COOH in PBS (pH 7.4) recorded before and after addition of 1000-fold molar excess of either carazolol or BI-167107 (average of 3 independent experiments). (c) Proposed mechanism of fluorescence quenching caused by carazolol. Intramolecular quenching may be induced by π-stacking between the carazolol and KK114 aromatic systems. (d) No-wash imaging experiment. Living U2OS cells expressing β2AR-YFP fusion protein were incubated for 90 min in presence of 100 nM carazolol-KK114 (24) in growth medium. Confocal images were recorded on a Leica SP8 microscope without washing off the excess of probe. Scale bar 50 µm.
Figure 7
Figure 7
Images of living cells expressing β2AR stained with fluorescent ligands. (a) STED image of a living U2OS cell expressing β2AR-YFP fusion protein labeled with carazolol-KK114 (24). The cells were incubated for 40 min in growth medium in presence of 100 nM carazolol-KK114 (24) and washed two times before imaging on an Abberior STED 775 QUAD scanning microscope. The inserts show zoomed-in confocal and STED images of the selected fragment (dotted square). Scale bars: 10 µm for the large image, 1 µm for the inserts. (b) Line profiles taken along the dotted line across the cell membrane in the zoomed-in regions. The confocal profile is fitted to Gaussian distribution, STED profile is fitted to Lorentz distribution. (c) STED image of live CAPAN-1 cells stained with 100 nM BI-PEG-KK114 (18). The cells were incubated for 40 min in growth medium in presence of a fluorescent ligand and washed two times before imaging on an Abberior STED 775 QUAD scanning microscope. The inserts show zoomed-in confocal and STED images of the selected fragment (dotted square). Scale bars: 10 µm for the large image, 1 µm for the inserts. (d) Line profiles taken along the dotted line across the cell membrane in the zoomed-in regions. The profile is fitted to multiple Gaussian distribution. (e,f) Competitive binding experiment with excess of non-fluorescent ligands: (e) confocal images of live CAPAN-1 cells stained with fluorescent ligands: ab118171 (5 nM), BI-PEG-BDY630 (17) (100 nM), carazolol-KK114 (24) (100 nM), BI-PEG-KK114 (18) (100 nM). (f) Same as (e), in the presence of excess (10 µM) of non-fluorescent ligands: carazolol for antagonists ab118171 and carazolol-KK114 (24); BI-167107 for agonists BI-PEG-BDY630 (17) and BI-PEG-KK114 (18). Scale bars 10 µm.

References

    1. Ross EM, Maguire ME, Sturgill TW, Biltonen RL, Gilman AG. Relationship between Beta-Adrenergic-Receptor and Adenylate-Cyclase - Studies of Ligand-Binding and Enzyme-Activity in Purified Membranes of S49 Lymphoma-Cells. J. Biol. Chem. 1977;252:5761–5775. - PubMed
    1. Delean A, Stadel JM, Lefkowitz RJ. A Ternary Complex Model Explains the Agonist-Specific Binding-Properties of the Adenylate Cyclase-Coupled Beta-Adrenergic-Receptor. J. Biol. Chem. 1980;255:7108–7117. - PubMed
    1. Rossi, A. M. & Taylor, C. W. Analysis of protein-ligand interactions by fluorescence polarization. Nat. Protoc. 6 (2011). - PMC - PubMed
    1. Sridharan R, Zuber J, Connelly SM, Mathew E, Dumont ME. Fluorescent approaches for understanding interactions of ligands with G protein coupled receptors. Biochim. Biophys. Acta. 2014;1838:15–33. doi: 10.1016/j.bbamem.2013.09.005. - DOI - PMC - PubMed
    1. Daly CJ, McGrath JC. Fluorescent ligands, antibodies, and proteins for the study of receptors. Pharmacol. Ther. 2003;100:101–118. doi: 10.1016/j.pharmthera.2003.08.001. - DOI - PubMed

Publication types

MeSH terms