. 2017 Sep 26;7(1):12305.
doi: 10.1038/s41598-017-12110-2.

Anti-mycobacterial activity correlates with altered DNA methylation pattern in immune cells from BCG-vaccinated subjects

Affiliations

Anti-mycobacterial activity correlates with altered DNA methylation pattern in immune cells from BCG-vaccinated subjects

Deepti Verma et al. Sci Rep. .

Abstract

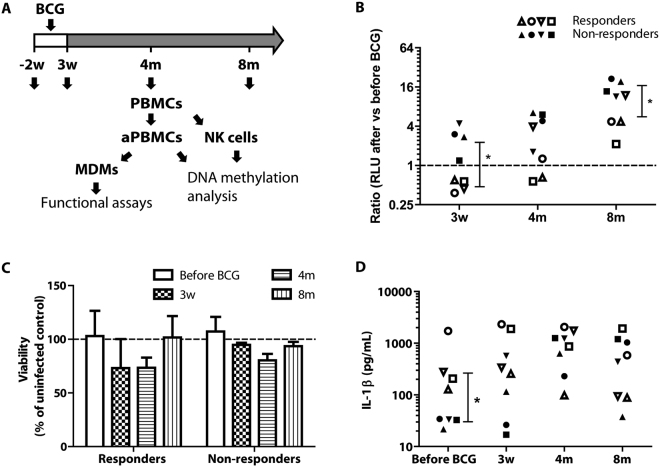
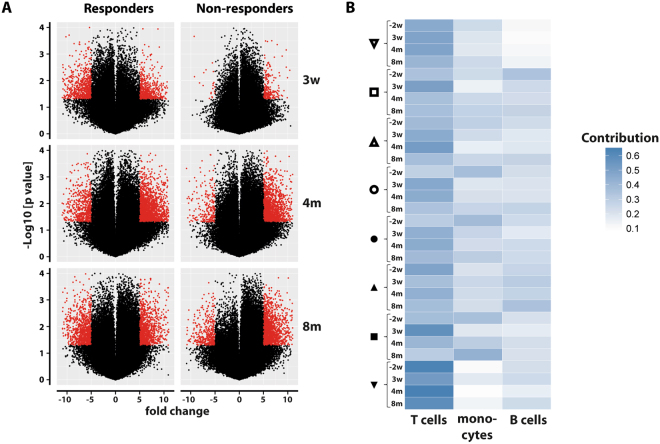
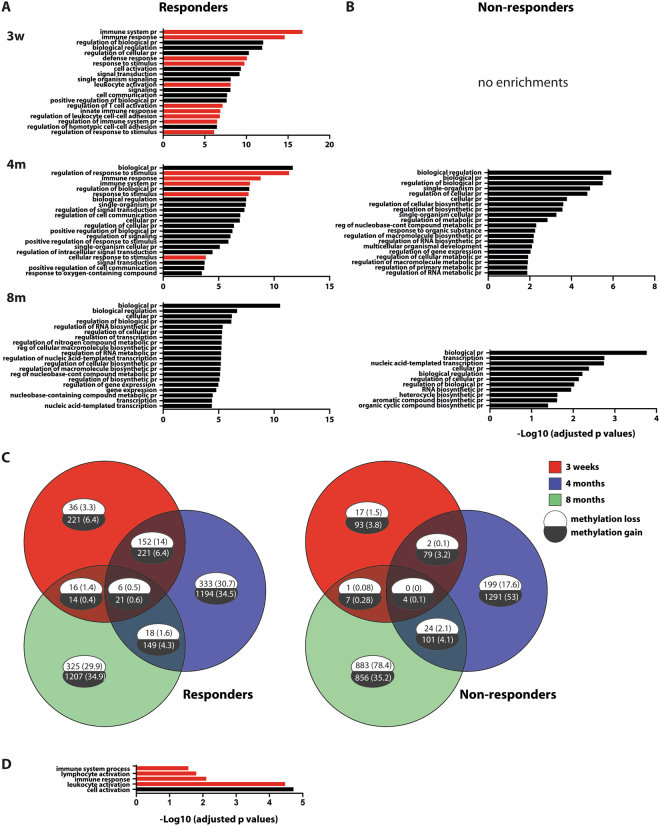
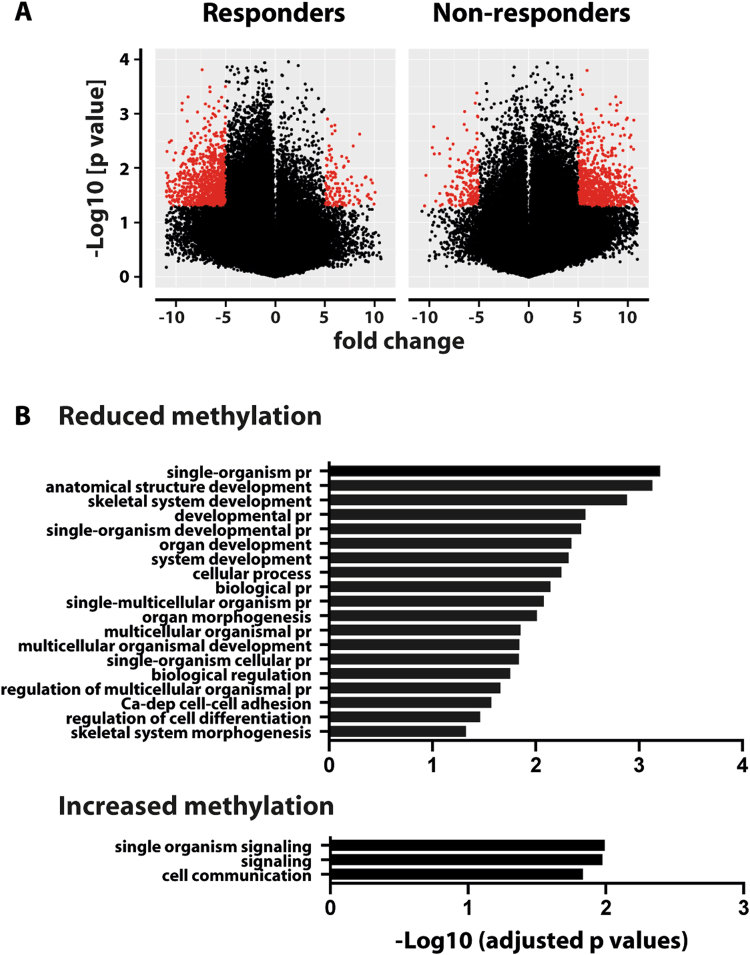
The reason for the largely variable protective effect against TB of the vaccine Bacille Calmette-Guerin (BCG) is not understood. In this study, we investigated whether epigenetic mechanisms are involved in the response of immune cells to the BCG vaccine. We isolated peripheral blood mononuclear cells (PBMCs) from BCG-vaccinated subjects and performed global DNA methylation analysis in combination with functional assays representative of innate immunity against Mycobacterium tuberculosis infection. Enhanced containment of replication was observed in monocyte-derived macrophages from a sub-group of BCG-vaccinated individuals (identified as 'responders'). A stable and robust differential DNA methylation pattern in response to BCG could be observed in PBMCs isolated from the responders but not from the non-responders. Gene ontology analysis revealed that promoters with altered DNA methylation pattern were strongly enriched among genes belonging to immune pathways in responders, however no enrichments could be observed in the non-responders. Our findings suggest that BCG-induced epigenetic reprogramming of immune cell function can enhance anti-mycobacterial immunity in macrophages. Understanding why BCG induces this response in responders but not in non-responders could provide clues to improvement of TB vaccine efficacy.


Conflict of interest statement

The authors declare that they have no competing interests.

Figures

Figure 1
Figure 1
Anti-mycobacterial activity and cytokine response to mycobacterial infection of MDMs. (A) Diagram of the blood collection timeline. Blood was collected 1–2 weeks before (−2W) and 3 weeks, 4 months and 8 months post-BCG vaccination. PBMCs were isolated for DNA isolation and methylation analysis or used to prepare monocyte-derived macrophages for infection with luciferase-expressing Mtb. (B) MDMs’ anti-mycobacterial capacity (as determined by the ratio of bacterial numbers at D4/D0 in each individual experiment) after vs before BCG vaccination were determined using luminometry. (C) MDM cell viability at 4 days of infection with H37Rv compared to uninfected cells from the same day as determined by calcein-AM fluorescence. (D) For cytokine analysis, the medium supernatant was collected at day 4 of infection and analyzed by cytometric bead array. Empty symbols represent responders while the solid symbols represent the non-responders. Statistical significance compared to before BCG was determined using Student’s one-sample t test, comparison between responders and non-responders was done using two-tailed Student’s t test and cytokines were compared using Mann-Whitney U test. *p < 0.05, **p < 0.01,***p < 0.001.
Figure 2
Figure 2
Global DNA methylation changes in aPBMCs of responders and non-responders. (A) Volcano plot showing the differential DNA methylation at 3 weeks, 4 months and 8 months compared to the time point before BCG. The red dots represent the promoters where the difference in methylation (β values) as compared to before BCG was greater than 5-fold. Red dots on the left represent the promoters with a loss of methylation while those on the right represent the promoters with a gain of methylation. (B) Heat map showing the individual cell types’ contribution to DNA methylation. Darker color represents a higher contribution.
Figure 3
Figure 3
Gene Ontology analysis of differentially methylated promoters in responders and non-responders. (AB) Gene ontology analysis using PANTHER with the DNA methylation data at 3 weeks, 4 months and 8 months describing the overrepresented biological pathways on the Y- axis and log 10 adjusted p values (<0.01) on the X- axis. Immune function-related pathways are represented as red bars. No enrichments were found for the non-responders at 3 weeks’ time point. (C) Venn diagram showing the overlap of differentially methylated promoters (represented as absolute numbers) at 3 weeks (pink), 4 months (blue) and 8 months (green). Numbers within brackets show the corresponding percentages of total hypo or hyper-methylated promoters. (D) gene ontology analysis of the promoters overlapping between the 3 weeks’ and 4 months’ time point in the responders. No corresponding enrichments were found for the non-responders. Promoters with a loss of methylation are shown in the white bubbles and those with a gain of methylation are shown in the black bubbles. Abbreviations: pr = process, reg = regulation.
Figure 4
Figure 4
Global DNA methylation changes in NK cells from responders and non- responders (A) Volcano plot showing the DNA methylation pattern in NK cells at 3 weeks compared to before BCG. The red dots represent the promoters where the difference in methylation β values as compared to before BCG was greater than 5-fold. Red dots on left represent the promoters with a loss of methylation while those on right represent the promoters with a gain of methylation. (B) Gene ontology analysis of differentially methylated promoters in NK cells at three weeks. The graphs depict the overrepresented biological pathways on the Y- axis and log 10 adjusted p values (<0.01) on the X- axis.

References

    1. Pitt, J. M., Blankley, S., McShane, H. & O’Garra, A. Vaccination against tuberculosis: How can we better BCG? Microb Pathog, doi:10.1016/j.micpath.2012.12.002 (2012). - PubMed
    1. Kagina BM, et al. Specific T cell frequency and cytokine expression profile do not correlate with protection against tuberculosis after bacillus Calmette-Guerin vaccination of newborns. Am J Respir Crit Care Med. 2010;182:1073–1079. doi: 10.1164/rccm.201003-0334OC. - DOI - PMC - PubMed
    1. Jones PA. Functions of DNA methylation: islands, start sites, gene bodies and beyond. Nature reviews. Genetics. 2012;13:484–492. doi: 10.1038/nrg3230. - DOI - PubMed
    1. Chen HP, Zhao YT, Zhao TC. Histone deacetylases and mechanisms of regulation of gene expression. Critical reviews in oncogenesis. 2015;20:35–47. doi: 10.1615/CritRevOncog.2015012997. - DOI - PMC - PubMed
    1. Kleinnijenhuis J, et al. Bacille Calmette-Guerin induces NOD2-dependent nonspecific protection from reinfection via epigenetic reprogramming of monocytes. Proc Natl Acad Sci USA. 2012;109:17537–17542. doi: 10.1073/pnas.1202870109. - DOI - PMC - PubMed

Publication types

MeSH terms