. 2017 Nov;101(22):8101-8113.
doi: 10.1007/s00253-017-8531-y. Epub 2017 Sep 26.

Metabolic characterization of a CHO cell size increase phase in fed-batch cultures

Affiliations

Metabolic characterization of a CHO cell size increase phase in fed-batch cultures

Xiao Pan et al. Appl Microbiol Biotechnol. 2017 Nov.

Abstract

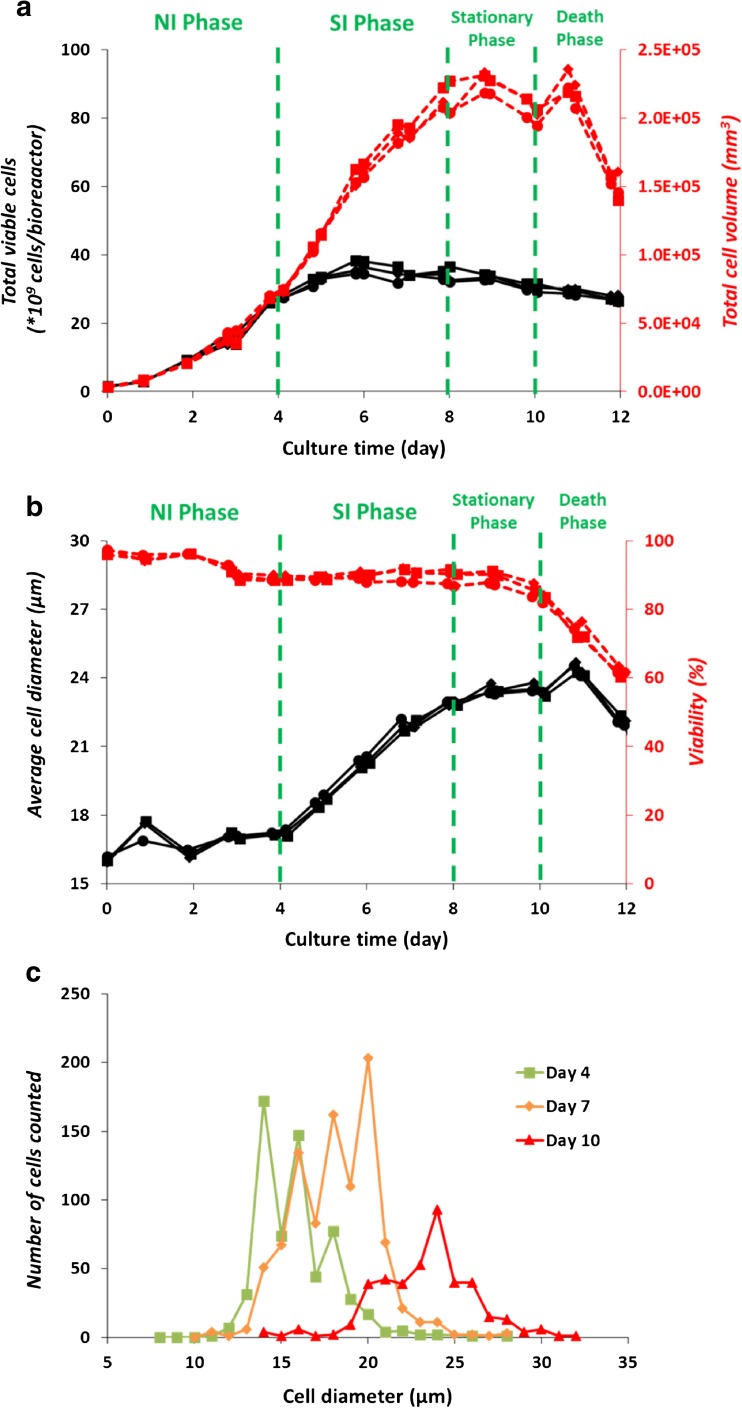
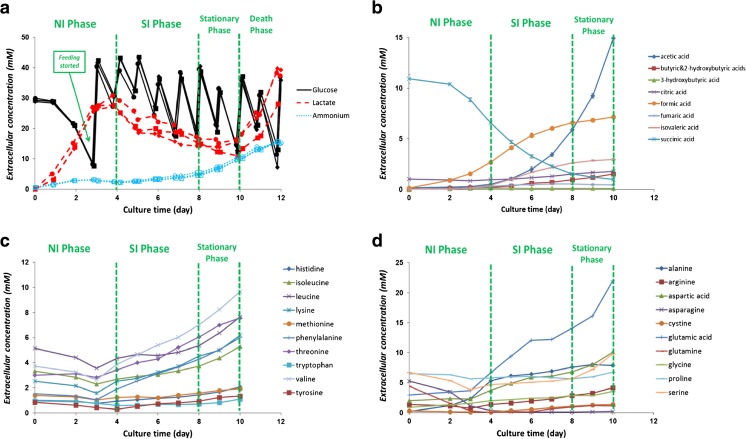
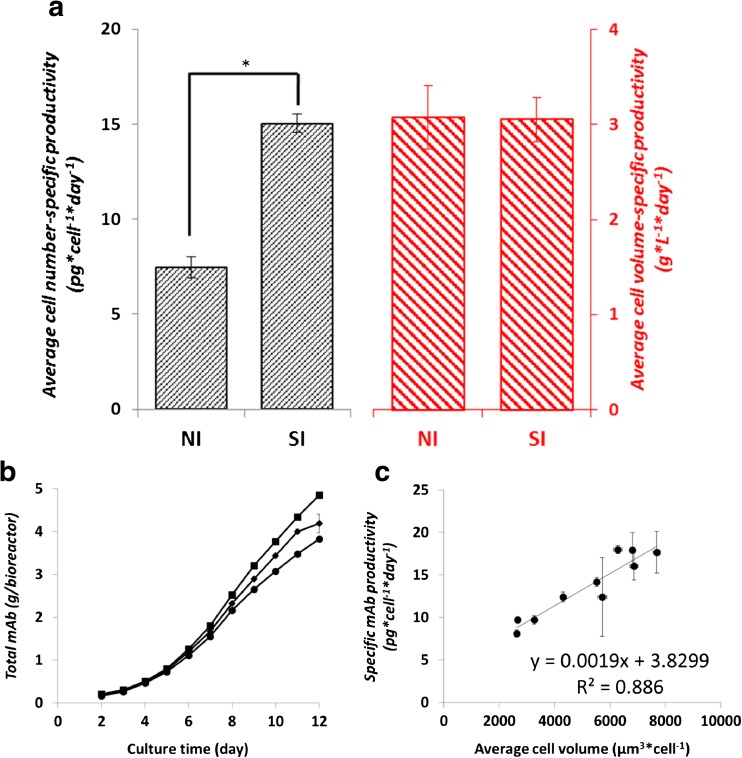
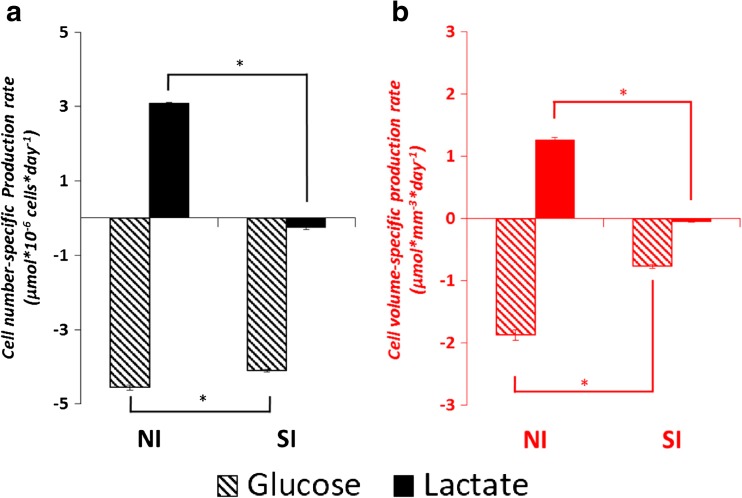
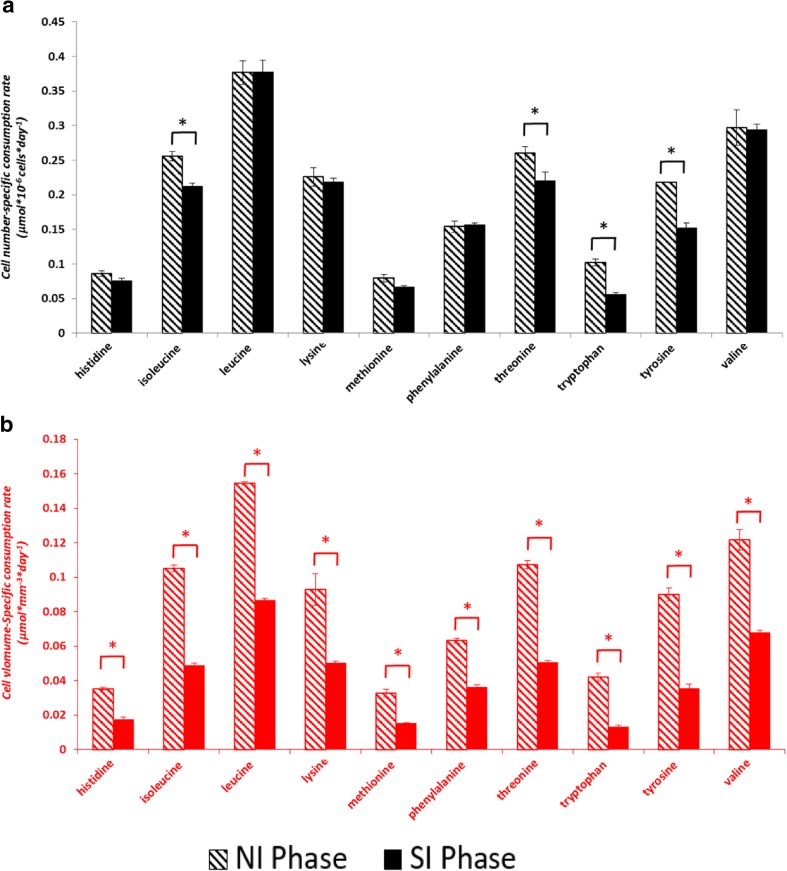
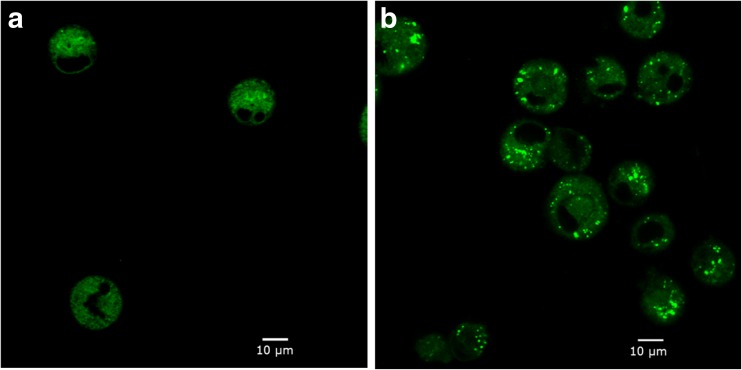
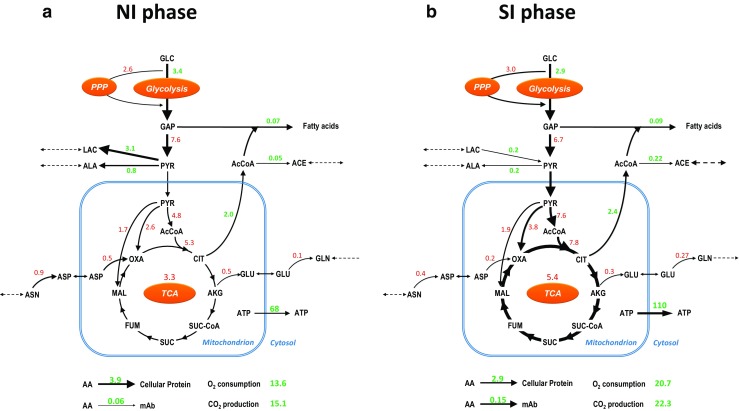
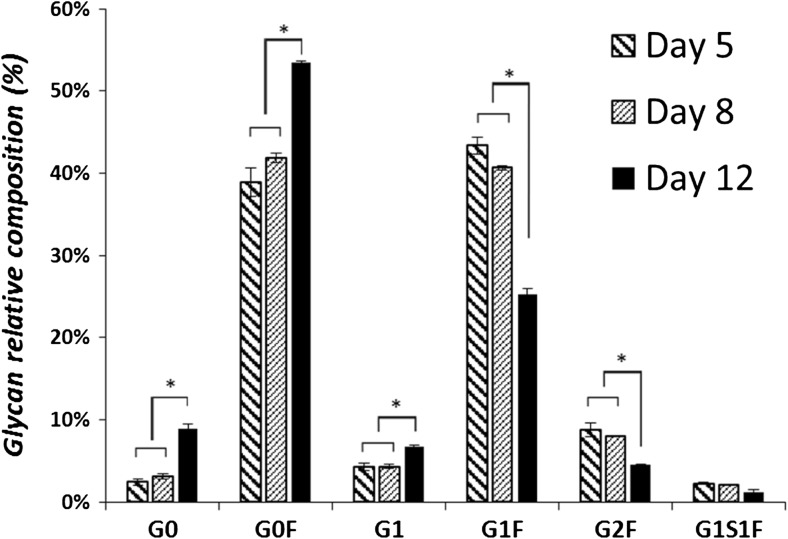
Normally, the growth profile of a CHO cell fed-batch process can be divided into two main phases based on changes in cell concentration, being an exponential growth phase and a stationary (non-growth) phase. In this study, an additional phase is observed during which the cell division comes to a halt but the cell growth continues in the form of an increase in cell size. The cell size increase (SI) phase occurs between the exponential proliferation phase (also called the number increase or NI phase) and the stationary phase. During the SI phase, the average volume and dry weight per cell increase threefold linearly with time. The average mAb specific productivity per cell increases linearly with the cell volume and therefore is on average two times higher in the SI phase than in the NI phase. The specific essential amino acids consumption rates per cell remain fairly constant between the NI and the SI phase, which agrees with the similar biomass production rate per cell between these two phases. Accumulation of fatty acids and formation of lipid droplets in the cells are observed during the SI phase, indicating that the fatty acids synthesis rate exceeds the demand for the synthesis of membrane lipids. A metabolic comparison between NI and SI phase shows that the cells with a larger size produce more mAb per unit of O2 and nutrient consumed, which can be used for further process optimization.

Keywords: Antibody production; Cell size increase; Chinese hamster ovary (CHO) cell; Fed-batch; Metabolic flux analysis; Phase transition.


Conflict of interest statement

Conflict of interest

The authors declare that they do not have any conflicts of interest.

Figures

Fig. 1
Fig. 1
a Total number of viable cells (×109, solid lines) and total volume of viable cells (mm3, dotted lines), and (b) average cell diameter (μm, solid lines) and viability (%, dotted lines) of reactor 1 (closed circles), 2 (closed diamonds), and 3 (closed squares). Cultures were divided into a number increase (NI) phase, a size increase (SI) phase, a stationary phase, and a death phase. (c) Cell diameter (μm) distribution during a representative fed-batch culture on day 4 (closed squares), 7 (closed diamonds), and 10 (closed triangles)
Fig. 2
Fig. 2
a Extracellular glucose (solid lines), lactate (dotted lines with closed marks), and ammonium (dotted lines with open marks) concentrations (mM) of reactor 1 (circles), 2 (diamonds), and 3 (squares). (b) Extracellular concentrations of measured organic acids. (c) Extracellular concentrations of essential amino acids. (d) Extracellular concentrations of non-essential amino acids. Feeding started on day 3. For glucose, lactate, and ammonium, samples were taken daily before and after feed addition. For the other organic acids and amino acids, samples were taken daily before feed addition. Error bars for all graphs indicate the standard deviation for the triplicate bioreactors
Fig. 3
Fig. 3
a Average cell number-specific (pg × cell−1 × day−1) and average cell volume-specific (g × L−1 × day−1) mAb productivity compared between the number increase (NI) and size increase (SI) phase of the cultures. *: significantly different (P < 0.05). b Total mAb produced (g) in reactor 1 (closed circles), 2 (closed diamonds), and 3 (closed squares). c Plot of specific mAb productivity (pg × cell−1 × day−1) against cell volume (μm3). Calculation was done per day from day 2 through day 12. Error bars of graph (a) and (c) show the standard deviation of triplicate fed-batch cultures. Error bars of graph (b) show the standard deviation of triplicate measurements for each fed-batch culture
Fig. 4
Fig. 4
(a) Cell number-based specific rates (μmol × 10−6 cells × day−1) and (b) cell volume-based specific rates (μmol × mm−3 × day−1) of glucose consumption and lactate production/consumption during the number increase (NI) and size increase (SI) phase of the fed-batch cultures. Positive values indicate production and negative values indicate consumption. Error bars show the standard deviation of triplicate fed-batch cultures. *: significantly different (P < 0.05)
Fig. 5
Fig. 5
a Cell number-specific consumption rates (μmol × 10−6 cells × day−1) and (b) Cell volume-specific consumption rates (μmol × mm−3 × day−1) of essential amino acids during the number increase (NI) and size increase (SI) phase of the fed-batch cultures. Error bars show the standard deviation of triplicate fed-batch cultures. *: significantly different (P < 0.05)
Fig. 6
Fig. 6
Lipid droplets stained with BODIPY 505/515 (green) during the CHO cell fed-batch on culture day 3 (a) and culture day 6 (b)
Fig. 7
Fig. 7
Major metabolic flux changes between (a) the number increase (NI) and size increase (SI) phase during the fed-batch cultures. The line thickness indicates the relative flux changes between the two presented phases. The average flux of the TCA cycle is represented by the average fluxes between the flux from citrate (CIT) to α-ketoglutarate (AKG) and the flux from succinate (SUC) to fumarate (FUM). The colors of the flux values indicate the flux variability result between the two phases. The green values show no overlap of the variable flux values between the two phases whereas the red values show there is overlap. The unit for flux values is mmol × 10−9 cells × day−1
Fig. 8
Fig. 8
Relative mAb N-glycan composition (%) of the 10 L cultures. N-glycans with different numbers of terminal residuals (G: galactose, F: fucose, S: sialic acid) are shown. Error bars show the standard deviation of the triplicate runs. *: significantly different (P < 0.05)

References

    1. Ahn WS, Antoniewicz MR. Metabolic flux analysis of CHO cells at growth and non-growth phases using isotopic tracers and mass spectrometry. Metab Eng. 2011;13:598–609. doi: 10.1016/j.ymben.2011.07.002. - DOI - PubMed
    1. Ahn WS, Antoniewicz MR. Parallel labeling experiments with [1,2-13C]glucose and [U-13C]glutamine provide new insights into CHO cell metabolism. Metab Eng. 2013;15:34–47. doi: 10.1016/j.ymben.2012.10.001. - DOI - PubMed
    1. Altamirano C, Illanes A, Casablancas A, Gámez X, Cairó JJ, Gòdia C. Analysis of CHO cells metabolic redistribution in a glutamate-based defined medium in continuous culture. Biotechnol Prog. 2001;17:1032–1041. doi: 10.1021/bp0100981. - DOI - PubMed
    1. Berlin E, Hannah JS, Yamane K, Peters RC, Howard BV. Fatty acid modification of membrane fluidity in Chinese hamster ovary (TR715-19) cells. Int J Biochem Cell Biol. 1996;28:1131–1139. doi: 10.1016/1357-2725(96)00063-5. - DOI - PubMed
    1. Bernson VSM. Acetyl-CoA hydrolase; activity, regulation and physiological, significance of the enzyme in Brown adipose tissue from hamster. Eur J Biochem. 1976;67:403–410. doi: 10.1111/j.1432-1033.1976.tb10705.x. - DOI - PubMed