. 2017 Nov 1;595(21):6653-6672.
doi: 10.1113/JP274792. Epub 2017 Oct 9.

Sensorimotor control of breathing in the mdx mouse model of Duchenne muscular dystrophy

Affiliations

Sensorimotor control of breathing in the mdx mouse model of Duchenne muscular dystrophy

David P Burns et al. J Physiol. .

Erratum in

  • Corrigendum.
    [No authors listed] [No authors listed] J Physiol. 2018 Jan 15;596(2):343-344. doi: 10.1113/JP275606. J Physiol. 2018. PMID: 29333654 Free PMC article. No abstract available.

Abstract

Key points: Respiratory failure is a leading cause of mortality in Duchenne muscular dystrophy (DMD), but little is known about the control of breathing in DMD and animal models. We show that young (8 weeks of age) mdx mice hypoventilate during basal breathing due to reduced tidal volume. Basal CO2 production is equivalent in wild-type and mdx mice. We show that carotid bodies from mdx mice have blunted responses to hyperoxia, revealing hypoactivity in normoxia. However, carotid body, ventilatory and metabolic responses to hypoxia are equivalent in wild-type and mdx mice. Our study revealed profound muscle weakness and muscle fibre remodelling in young mdx diaphragm, suggesting severe mechanical disadvantage in mdx mice at an early age. Our novel finding of potentiated neural motor drive to breathe in mdx mice during maximal chemoactivation suggests compensatory neuroplasticity enhancing respiratory motor output to the diaphragm and probably other accessory muscles.

Abstract: Patients with Duchenne muscular dystrophy (DMD) hypoventilate with consequential arterial blood gas derangement relevant to disease progression. Whereas deficits in DMD diaphragm are recognized, there is a paucity of knowledge in respect of the neural control of breathing in dystrophinopathies. We sought to perform an analysis of respiratory control in a model of DMD, the mdx mouse. In 8-week-old male wild-type and mdx mice, ventilation and metabolism, carotid body afferent activity, diaphragm muscle force-generating capacity, and muscle fibre size, distribution and centronucleation were determined. Diaphragm EMG activity and responsiveness to chemostimulation was determined. During normoxia, mdx mice hypoventilated, owing to a reduction in tidal volume. Basal CO2 production was not different between wild-type and mdx mice. Carotid sinus nerve responses to hyperoxia were blunted in mdx, suggesting hypoactivity. However, carotid body, ventilatory and metabolic responses to hypoxia were equivalent in wild-type and mdx mice. Diaphragm force was severely depressed in mdx mice, with evidence of fibre remodelling and damage. Diaphragm EMG responses to chemoactivation were enhanced in mdx mice. We conclude that there is evidence of chronic hypoventilation in young mdx mice. Diaphragm dysfunction confers mechanical deficiency in mdx resulting in impaired capacity to generate normal tidal volume at rest and decreased absolute ventilation during chemoactivation. Enhanced mdx diaphragm EMG responsiveness suggests compensatory neuroplasticity facilitating respiratory motor output, which may extend to accessory muscles of breathing. Our results may have relevance to emerging treatments for human DMD aiming to preserve ventilatory capacity.

Keywords: Duchenne muscular dystrophy; EMG; carotid body; diaphragm; hypoventilation; mdx.


Figures

Figure 1
Figure 1. Baseline ventilation in conscious mice
A, representative respiratory flow traces during normoxic ventilation in a wild‐type (WT) mouse (black) and mdx mouse (grey); inspiration downwards. BD, breathing frequency (B), tidal volume (C) and minute ventilation (D) for WT (n = 13) and mdx (n = 12) mice during normoxic ventilation. Values (BD) are expressed as box and whisker plots (median, 25–75% centiles and minimum and maximum values) and data were statistically compared by unpaired Student's t tests with Welch's correction used where appropriate. *** P<0.001 compared with WT.
Figure 2
Figure 2. Ex vivo carotid sinus nerve discharge
A and B, representative recordings of integrated carotid sinus nerve (CSN) activity ex vivo in a wild‐type mouse (A) and mdx mouse (B) during normoxia (100 mmHg) and mild (80 mmHg), moderate (60 mmHg) and severe (40 mmHg) hypoxia. CSN activity was normalized to activity in hyperoxia (500 mmHg), illustrated by the horizontal dashed line. C, group data of CSN activity for wild‐type (WT, n = 6) and mdx mice (n = 6) during normoxia (100 mmHg) and graded hypoxia (80, 60, 40 mmHg). Values are expressed as box and whisker plots (median, 25–75% centiles and minimum and maximum values). Data were statistically compared by repeated measures two‐way ANOVA (gas × gene). [Color figure can be viewed at wileyonlinelibrary.com]
Figure 3
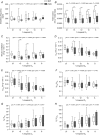
Figure 3. Ventilatory and metabolic responsiveness to graded hypoxia
AH, group data for breathing frequency (A), tidal volume (B), minute ventilation (C), oxygen consumption (D; VO2), carbon dioxide production (E; VCO2), respiratory exchange ratio (F; VCO2/VO2), ventilatory equivalent for oxygen (G; V E/VO2) and ventilatory equivalent for carbon dioxide (H; V E/VCO2) for wild‐type (WT, n = 13) and mdx (n = 12) mice during normoxia (21% inspired O2; balance N2) and graded hypoxia (15, 12, 10 and 8% inspired O2; balance N2). Values are expressed as box and whisker plots (median, 25–75% centiles and minimum and maximum values). Data were statistically compared by repeated measures two‐way ANOVA (gas × gene) with Bonferroni post hoc test. * P<0.05, ** P<0.01 compared with corresponding WT value.
Figure 4
Figure 4. Ventilatory and metabolic responsiveness to sustained hypoxia
AH, group data (mean ± SD) for breathing frequency (A), tidal volume (B), minute ventilation (C), oxygen consumption (D; VO2), carbon dioxide production (E; VCO2), respiratory exchange ratio (F; VCO2/VO2), ventilatory equivalent for oxygen (G; V E/VO2) and ventilatory equivalent for carbon dioxide (H; V E/VCO2) for wild‐type (WT, n = 13) and mdx (n = 12) mice during baseline and after 5–20 min of exposure to hypoxia (10% O2 inspired oxygen; balance N2). Data were statistically compared by repeated measures two‐way ANOVA (gas × gene) with Bonferroni post hoc test. * P<0.05, ** P<0.01 compared with corresponding WT value.
Figure 5
Figure 5. Ventilatory responsiveness to hypercapnia
A, group data (mean ± SD) for minute ventilation in wild‐type (WT, n = 10) and mdx (n = 11) mice during baseline (air) and hypercapnia (5% CO2, balance O2). Data were statistically compared using repeated measures two‐way ANOVA. B, group data (mean ± SD) for ventilatory responsiveness to hypercapnia (ΔV E) in WT (n = 10) and mdx (n = 11) mice. Values are expressed as box and whisker plots (median, 25–75% centiles and minimum and maximum values). Data were statistically compared by unpaired Student's t tests.
Figure 6
Figure 6. Ex vivo diaphragm muscle contractile function
A and B, original traces of ex vivo diaphragm muscle twitch contraction (A) and force–frequency relationship (B) for wild‐type (WT) (black) and mdx (grey) preparations. C, group data (mean ± SD; n = 7 for both groups) for diaphragm muscle force–frequency relationship ex vivo in WT (open) and mdx (grey) muscle preparations. Data were statistically compared by repeated measures two‐way ANOVA (frequency × gene) followed by Bonferroni post hoc test. ** P < 0.01, *** P < 0.001 compared with corresponding WT value.
Figure 7
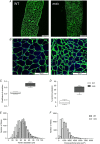
Figure 7. Diaphragm muscle structure
A, representative images of diaphragm muscle immunofluorescently labelled for laminin from wild‐type (WT) (top left) and mdx (top right) mice. B, representative images of diaphragm muscle immunofluorescently labelled for laminin (green) and myonuclei (blue) from WT (bottom left) and mdx (bottom right) mice. C, group data for coefficient of variation of diaphragm muscle fibre size as measured by minimal Feret's diameter for WT (n = 8) and mdx (n = 8) mice. D, group data for percentage of fibres with centralized myonuclei in diaphragm muscle of WT (n = 6) and mdx (n = 5) mice. Values are expressed as box and whisker plots (median, 25–75% centiles and minimum and maximum values). Data were statistically compared by unpaired Student's t tests. E and F, frequency distribution of WT and mdx diaphragm muscle fibre size as measured by minimal Feret's diameter (E) and cross‐sectional area (F). *** P = 0.0005, **** P < 0.0001 compared with corresponding WT value.
Figure 8
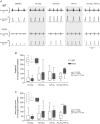
Figure 8. Diaphragm EMG
A, representative traces of diaphragm (Dia) muscle raw and integrated (Int.) EMG activity for a wild‐type (WT) mouse (black) and mdx mouse (grey) during baseline (60% inspired O2), hypercapnia (5% and 10% CO2), hypoxia (15% O2) and asphyxia (15% O2/5% CO2). B and C, diaphragm muscle integrated EMG activity expressed as amplitude (B) and area under the curve (C) for WT (n = 8) and mdx (n = 7) mice during baseline (inset), hypercapnia (5% CO2 and 10% CO2), hypoxia (15% O2) and asphyxia (15% O2/5% CO2). Baseline data are reported as absolute units. Note that there was no significant difference in baseline data comparing WT and mdx mice. Gas challenges are expressed as % change from baseline. All values are presented as box and whisker plots (median, 25–75% centiles and minimum and maximum values). Baseline data were statistically compared by unpaired Student's t tests. Gas challenges were statistically compared by repeated measures two‐way ANOVA with Bonferroni post hoc test. * P < 0.05 compared with WT.

References

    1. Bavis RW, van Heerden ES, Brackett DG, Harmeling LH, Johnson SM, Blegen HJ, Logan S, Nguyen GN & Fallon SC (2014). Postnatal development of eupneic ventilation and metabolism in rats chronically exposed to moderate hyperoxia. Respir Physiol Neurobiol 198, 1–12. - PMC - PubMed
    1. Bavis RW, Young KM, Barry KJ, Boller MR, Kim E, Klein PM, Ovrutsky AR & Rampersad DA (2010). Chronic hyperoxia alters the early and late phases of the hypoxic ventilatory response in neonatal rats. J Appl Physiol (1985) 109, 796–803. - PMC - PubMed
    1. Baydur A, Gilgoff I, Prentice W, Carlson M & Fischer DA (1990). Decline in respiratory function and experience with long‐term assisted ventilation in advanced Duchenne's muscular dystrophy. Chest 97, 884–889. - PubMed
    1. Beck J, Weinberg J, Hamnegård CH, Spahija J, Olofson J, Grimby G & Sinderby C (2006). Diaphragmatic function in advanced Duchenne muscular dystrophy. Neuromuscul Disord 16, 161–167. - PubMed
    1. Bersanini C, Khirani S, Ramirez A, Lofaso F, Aubertin G, Beydon N, Mayer M, Maincent K, Boulé M & Fauroux B (2012). Nocturnal hypoxaemia and hypercapnia in children with neuromuscular disorders. Eur Respir J 39, 1206–1212. - PubMed

Publication types

Grants and funding