. 2017 Jan 21;4(1):4.
doi: 10.3390/bioengineering4010004.

Iron Oxide Nanoparticles Stimulates Extra-Cellular Matrix Production in Cellular Spheroids

Affiliations

Iron Oxide Nanoparticles Stimulates Extra-Cellular Matrix Production in Cellular Spheroids

Megan Casco et al. Bioengineering (Basel). .

Abstract

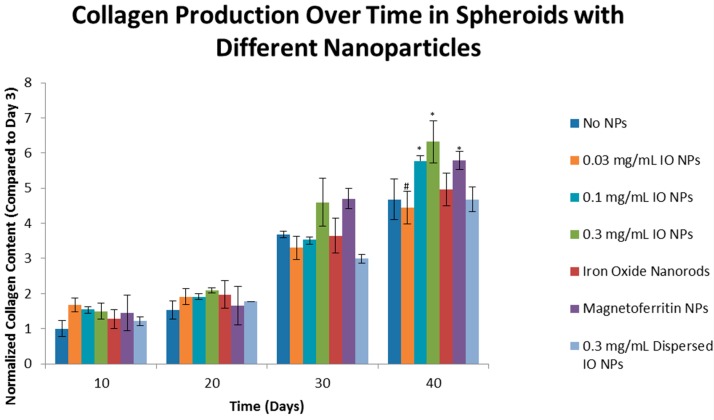
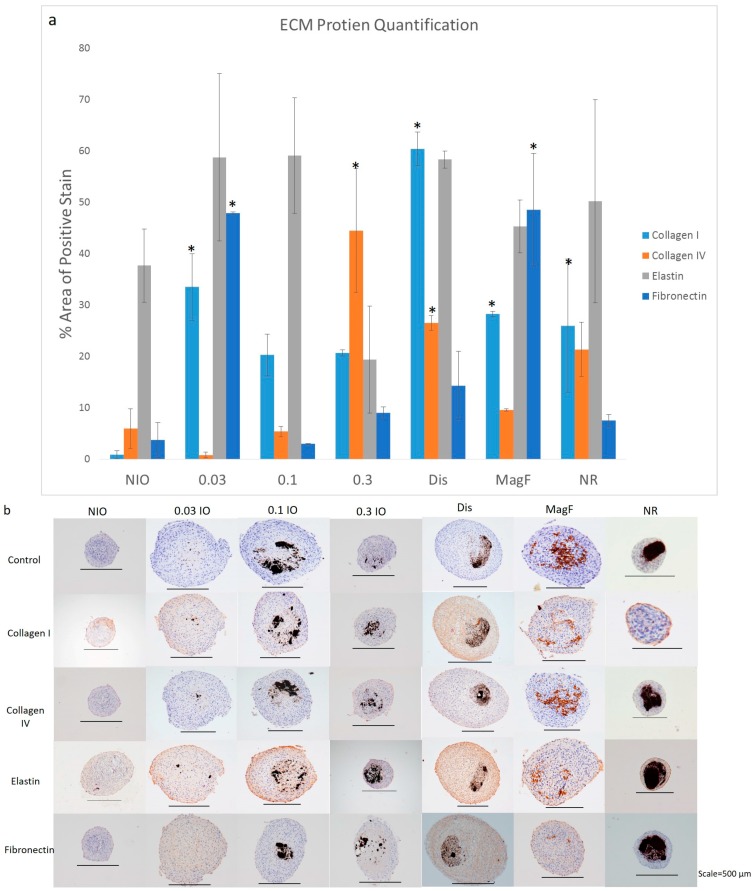
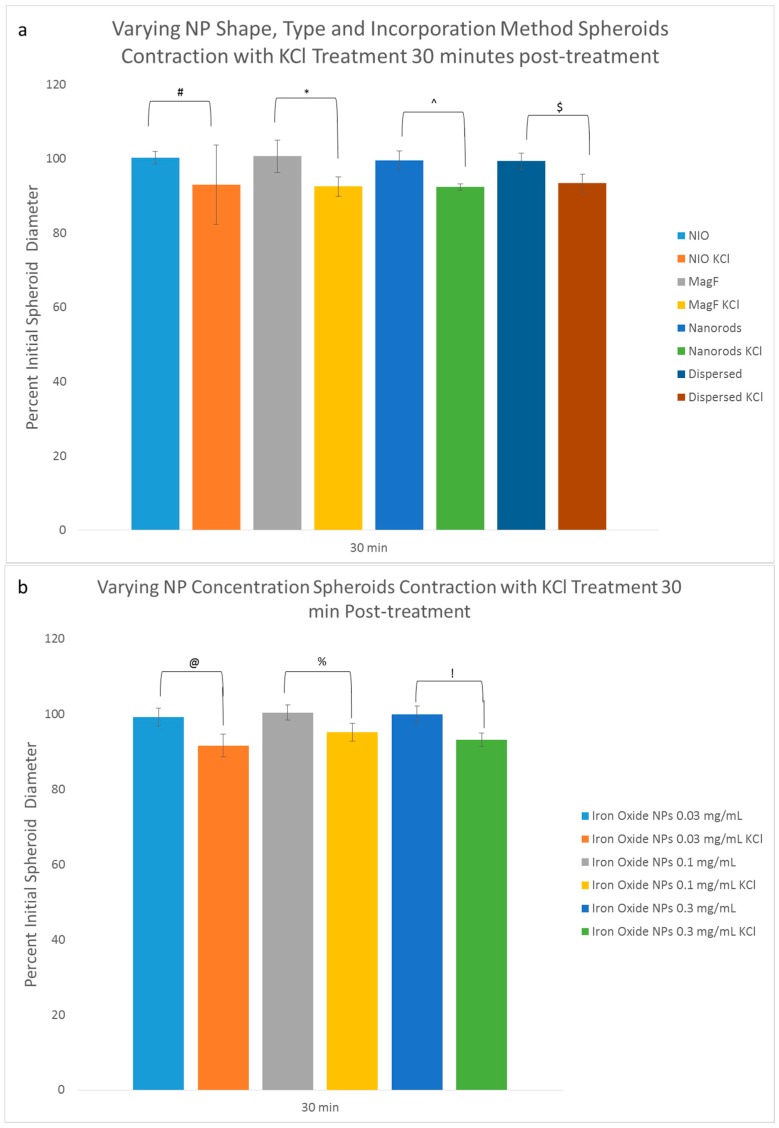
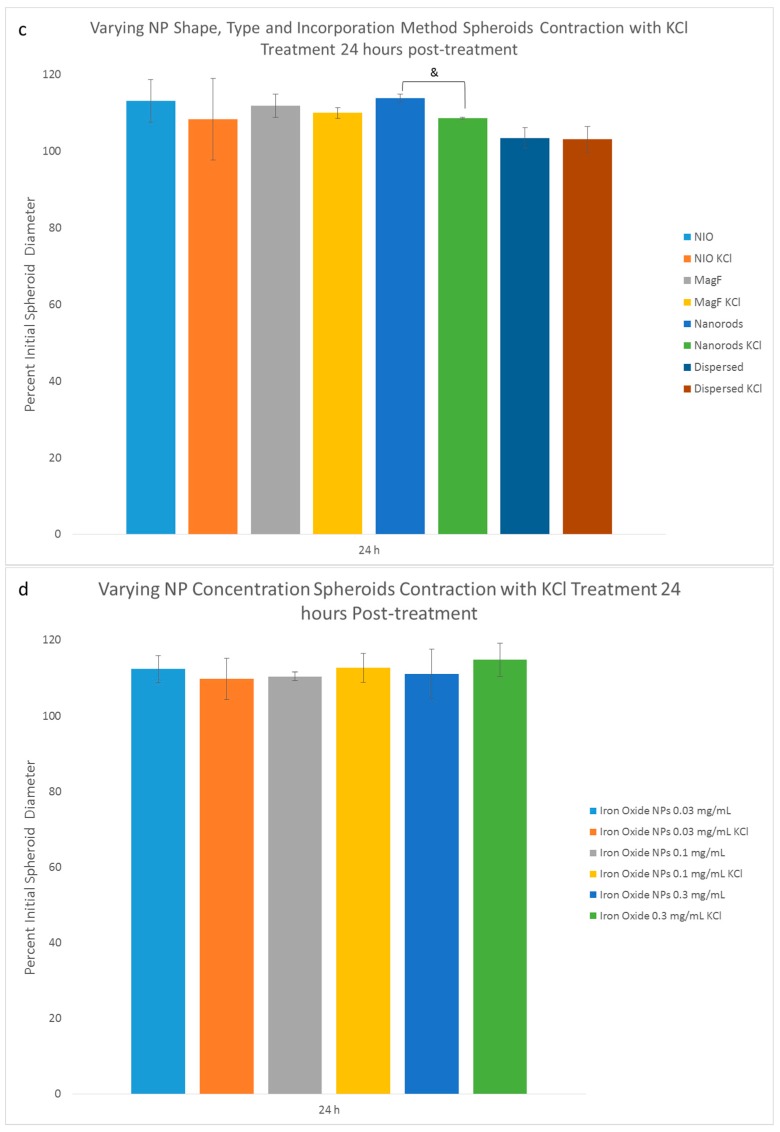
Nanotechnologies have been integrated into drug delivery, and non-invasive imaging applications, into nanostructured scaffolds for the manipulation of cells. The objective of this work was to determine how the physico-chemical properties of magnetic nanoparticles (MNPs) and their spatial distribution into cellular spheroids stimulated cells to produce an extracellular matrix (ECM). The MNP concentration (0.03 mg/mL, 0.1 mg/mL and 0.3 mg/mL), type (magnetoferritin), shape (nanorod-85 nm × 425 nm) and incorporation method were studied to determine each of their effects on the specific stimulation of four ECM proteins (collagen I, collagen IV, elastin and fibronectin) in primary rat aortic smooth muscle cell. Results demonstrated that as MNP concentration increased there was up to a 6.32-fold increase in collagen production over no MNP samples. Semi-quantitative Immunohistochemistry (IHC) results demonstrated that MNP type had the greatest influence on elastin production with a 56.28% positive area stain compared to controls and MNP shape favored elastin stimulation with a 50.19% positive area stain. Finally, there are no adverse effects of MNPs on cellular contractile ability. This study provides insight on the stimulation of ECM production in cells and tissues, which is important because it plays a critical role in regulating cellular functions.

Keywords: extracellular matrix; magnetic nanoparticles; spheroids; tissue engineering.


Conflict of interest statement

The authors declare no conflict of interest.

Figures

Figure 1
Figure 1
H & E and Masson’s Trichrome Staining for magnetic nanoparticles (MNP) spheroids. Spheroids were fabricated with varying MNP concentrations, type, shape, incorporation method, or no MNP. After (a) Day 3 and (b) Day 40 time points, spheroids were collected, fixed, and processed for histological examination. The H & E stain demonstrates the presence of nuclei throughout all formulations of spheroids after 3 and 40 days. The Masson’s Trichrome stain demonstrates an increased presence of collagen (represented by the blue in the samples) in the Janus, 0.1 mg/mL iron oxide (IO), and magnetoferritin spheroids on Day 40.
Figure 2
Figure 2
Effect of Concentration, Type, Shape, and Incorporation Method of magnetic nanoparticles on Collagen Synthesis over Time. Results of hydroxyproline assay quantitatively demonstrates that there is an increase in collagen production in all spheroid types over 40 days. When compared to the Day 40 control, no iron oxide (NIO), there is only a statistical difference (p < 0.05, as indicated by “*”) for 0.1 mg/mL IO, magnetoferritin, and Janus spheroids. The results indicate that the higher concentrations of iron oxide and biological MNPs produce higher amounts of collagen, relative to the control. The results show that the when the IO formulations are compared to each other, there was a significant difference between Janus, as the control, and 0.03 mg/mL IO (p < 0.05, as indicated by “#”). This supports the earlier results that the higher concentrations of IO increase collagen production.
Figure 3
Figure 3
Immunohistochemistry Staining for MNP spheroids. Spheroids were fabricated with varying MNP concentrations, type, shape, incorporation method, or no MNP. (a) After day 40 time point, spheroids were collected, fixed and processed for immunohistochemical examination for collagen I, collagen IV, elastin and fibronectin. Image J was used to quantify the percent area of positive stain for the various samples. “*” represents samples that have ECM protein production that is significantly different from the NIO control (b) NIO, 0.03 mg/mL IO, 0.1 mg/mL IO, 0.3 mg/mL IO, dispersed (0.3 mg/mL IO), magnetoferritin, and nanorods stained for collagen I, collagen IV, elastin and fibronectin with a control that was not stained.
Figure 4
Figure 4
Potassium Chloride Functional Assay. (a–d) Spheroids were fabricated with varying NP concentrations shape, type, and incorporation method. Two sets of spheroids were collected from each group after 3 days of fusing (n = 5). One from each set were treated with KCl and the other set was the control. Spheroids were imaged before KCl treatment, 30 min and 24 h after KCl treatment. Percent initial spheroid diameter for KCl treated samples were compared to their counterparts without the treatment at 30 min and 24 h. The results indicate that there is statistical difference between all the treatment and non-treatment groups at 30 min and only nanorods at 24 h showed a significant difference in percent initial diameter between KCl treatment and non-treatment samples. This statistical difference is represented by “#”, “*”, “^” “$”, “@”, “%”, “!”, and “&” for (a–d). This suggests that none of the experimental groups have an adverse effect on the functionality of the spheroids; (e) Spheroids were fabricated with varying amounts of collagen content. Two sets of spheroids were collected from each group after 3 days of fusing (n = 5). The results indicate that there is a statistical difference (represented by “*” and “#”) after 30 min of KCl treatment between experimental group and control for 0.017 mg/mL and 0.1 mg/mL of collagen. After 24 h there is no statistical difference between the groups.
Figure 4
Figure 4
Potassium Chloride Functional Assay. (a–d) Spheroids were fabricated with varying NP concentrations shape, type, and incorporation method. Two sets of spheroids were collected from each group after 3 days of fusing (n = 5). One from each set were treated with KCl and the other set was the control. Spheroids were imaged before KCl treatment, 30 min and 24 h after KCl treatment. Percent initial spheroid diameter for KCl treated samples were compared to their counterparts without the treatment at 30 min and 24 h. The results indicate that there is statistical difference between all the treatment and non-treatment groups at 30 min and only nanorods at 24 h showed a significant difference in percent initial diameter between KCl treatment and non-treatment samples. This statistical difference is represented by “#”, “*”, “^” “$”, “@”, “%”, “!”, and “&” for (a–d). This suggests that none of the experimental groups have an adverse effect on the functionality of the spheroids; (e) Spheroids were fabricated with varying amounts of collagen content. Two sets of spheroids were collected from each group after 3 days of fusing (n = 5). The results indicate that there is a statistical difference (represented by “*” and “#”) after 30 min of KCl treatment between experimental group and control for 0.017 mg/mL and 0.1 mg/mL of collagen. After 24 h there is no statistical difference between the groups.

References

    1. Corchero J.L., Seras J., García-Fruitós E., Vazquez E., Villaverde A. Nanoparticle assisted tissue engineering. Biotechnol. Int. 2010;22:13–16.
    1. Mattix B., Olsen T.R., Gu Y., Casco M., Herbst A., Simionescu D.T., Visconti R.P., Kornev K.G., Alexis F. Biological magnetic cellular spheroids as building blocks for tissue engineering. Acta Biomater. 2014;10:623–629. doi: 10.1016/j.actbio.2013.10.021. - DOI - PMC - PubMed
    1. Ho V.H.B., Müller K.H., Barcza A., Chen R., Slater N.K.H. Generation and manipulation of magnetic multicellular spheroids. Biomaterials. 2010;31:3095–3102. doi: 10.1016/j.biomaterials.2009.12.047. - DOI - PubMed
    1. Lin R.-Z., Chu W.-C., Chiang C.-C., Lai C.-H., Chang H.-Y. Magnetic reconstruction of three-dimensional tissues from multicellular spheroids. Tissue Eng. C Methods. 2008;14:197–205. doi: 10.1089/ten.tec.2008.0061. - DOI - PubMed
    1. Mattix B.M., Olsen T.R., Casco M., Reese L., Poole J.T., Zhang J., Visconti R.P., Simionescu A., Simionescu D.T., Alexis F. Janus magnetic cellular spheroids for vascular tissue engineering. Biomaterials. 2014;35:949–960. doi: 10.1016/j.biomaterials.2013.10.036. - DOI - PMC - PubMed

LinkOut - more resources