

Lagrangian Trajectories to Predict the Formation of Population Heterogeneity in Large-Scale Bioreactors
- PMID: 28952507
- PMCID: PMC5590480
- DOI: 10.3390/bioengineering4020027
Lagrangian Trajectories to Predict the Formation of Population Heterogeneity in Large-Scale Bioreactors
Abstract
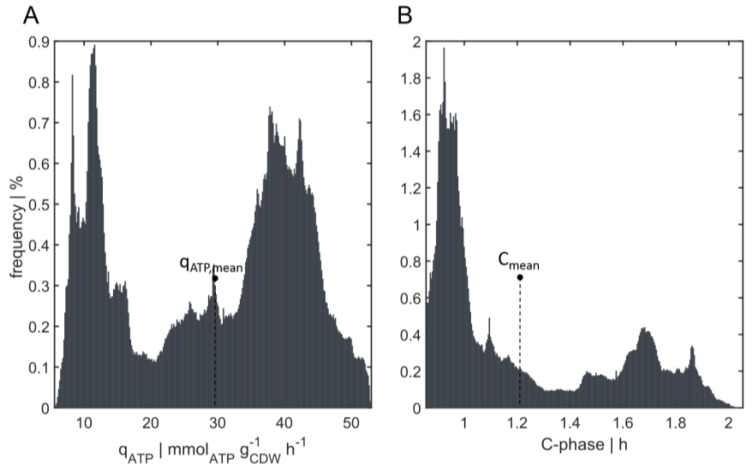
Successful scale-up of bioprocesses requires that laboratory-scale performance is equally achieved during large-scale production to meet economic constraints. In industry, heuristic approaches are often applied, making use of physical scale-up criteria that do not consider cellular needs or properties. As a consequence, large-scale productivities, conversion yields, or product purities are often deteriorated, which may prevent economic success. The occurrence of population heterogeneity in large-scale production may be the reason for underperformance. In this study, an in silico method to predict the formation of population heterogeneity by combining computational fluid dynamics (CFD) with a cell cycle model of Pseudomonas putida KT2440 was developed. The glucose gradient and flow field of a 54,000 L stirred tank reactor were generated with the Euler approach, and bacterial movement was simulated as Lagrange particles. The latter were statistically evaluated using a cell cycle model. Accordingly, 72% of all cells were found to switch between standard and multifork replication, and 10% were likely to undergo massive, transcriptional adaptations to respond to extracellular starving conditions. At the same time, 56% of all cells replicated very fast, with µ ≥ 0.3 h-1 performing multifork replication. The population showed very strong heterogeneity, as indicated by the observation that 52.9% showed higher than average adenosine triphosphate (ATP) maintenance demands (12.2%, up to 1.5 fold). These results underline the potential of CFD linked to structured cell cycle models for predicting large-scale heterogeneity in silico and ab initio.
Keywords: Lagrange trajectory; cell cycle model; computational fluid dynamics; energy level; population dynamics; scale-up; stirred tank reactor.
Conflict of interest statement
The authors declare no conflicts of interest.
Figures

Similar articles
-
Data-driven in silico prediction of regulation heterogeneity and ATP demands of Escherichia coli in large-scale bioreactors.Biotechnol Bioeng. 2021 Jan;118(1):265-278. doi: 10.1002/bit.27568. Epub 2020 Oct 7. Biotechnol Bioeng. 2021. PMID: 32940924
-
Coupled metabolic-hydrodynamic modeling enabling rational scale-up of industrial bioprocesses.Biotechnol Bioeng. 2020 Mar;117(3):844-867. doi: 10.1002/bit.27243. Epub 2019 Dec 20. Biotechnol Bioeng. 2020. PMID: 31814101 Review.
-
Simulated oxygen and glucose gradients as a prerequisite for predicting industrial scale performance a priori.Biotechnol Bioeng. 2020 Sep;117(9):2760-2770. doi: 10.1002/bit.27457. Epub 2020 Jul 2. Biotechnol Bioeng. 2020. PMID: 32530496
-
Synergistically applying 1-D modeling and CFD for designing industrial scale bubble column syngas bioreactors.Eng Life Sci. 2020 Feb 13;20(7):239-251. doi: 10.1002/elsc.201900132. eCollection 2020 Jul. Eng Life Sci. 2020. PMID: 32647503 Free PMC article.
-
Potential and constraints for the application of CFD combined with Lagrangian particle tracking to dry powder inhalers.Eur J Pharm Sci. 2019 Feb 1;128:299-324. doi: 10.1016/j.ejps.2018.12.008. Epub 2018 Dec 14. Eur J Pharm Sci. 2019. PMID: 30553814 Review.
Cited by
-
Scale-Up Technologies for the Manufacture of Adherent Cells.Front Nutr. 2020 Nov 4;7:575146. doi: 10.3389/fnut.2020.575146. eCollection 2020. Front Nutr. 2020. PMID: 33251241 Free PMC article. Review.
-
Heterogeneity in Pure Microbial Systems: Experimental Measurements and Modeling.Front Microbiol. 2017 Sep 20;8:1813. doi: 10.3389/fmicb.2017.01813. eCollection 2017. Front Microbiol. 2017. PMID: 28970826 Free PMC article. Review.
-
Real Case Study of 600 m3 Bubble Column Fermentations: Spatially Resolved Simulations Unveil Optimization Potentials for l-Phenylalanine Production With Escherichia coli.Biotechnol Bioeng. 2025 Feb;122(2):265-286. doi: 10.1002/bit.28869. Epub 2024 Oct 25. Biotechnol Bioeng. 2025. PMID: 39450684 Free PMC article.
-
Optimization and Scale-Up of Fermentation Processes Driven by Models.Bioengineering (Basel). 2022 Sep 14;9(9):473. doi: 10.3390/bioengineering9090473. Bioengineering (Basel). 2022. PMID: 36135019 Free PMC article. Review.
-
From Spatial-Temporal Multiscale Modeling to Application: Bridging the Valley of Death in Industrial Biotechnology.Bioengineering (Basel). 2023 Jun 20;10(6):744. doi: 10.3390/bioengineering10060744. Bioengineering (Basel). 2023. PMID: 37370675 Free PMC article. Review.
References
-
- Bylund F., Collet E., Enfors S., Larsson G. Substrate gradient formation in the large-scale bioreactor lowers cell yield and increases by-product formation. Bioprocess Eng. 1998;18:171–180. doi: 10.1007/s004490050427. - DOI
LinkOut - more resources
Full Text Sources
Other Literature Sources
Research Materials
Miscellaneous
