

Patterns of blood pressure response during intensive BP lowering and clinical events: results from the secondary prevention of small subcortical strokes trial
- PMID: 28952798
- PMCID: PMC5818304
- DOI: 10.1080/08037051.2017.1382310
Patterns of blood pressure response during intensive BP lowering and clinical events: results from the secondary prevention of small subcortical strokes trial
Abstract
Purpose: We applied cluster analysis to identify discrete patterns of concomitant responses of systolic (SBP), diastolic (DBP) and pulse pressure (PP) during intensive BP lowering; and to evaluate their clinical relevance and association with risk of mortality, major vascular events (MVEs), and stroke.
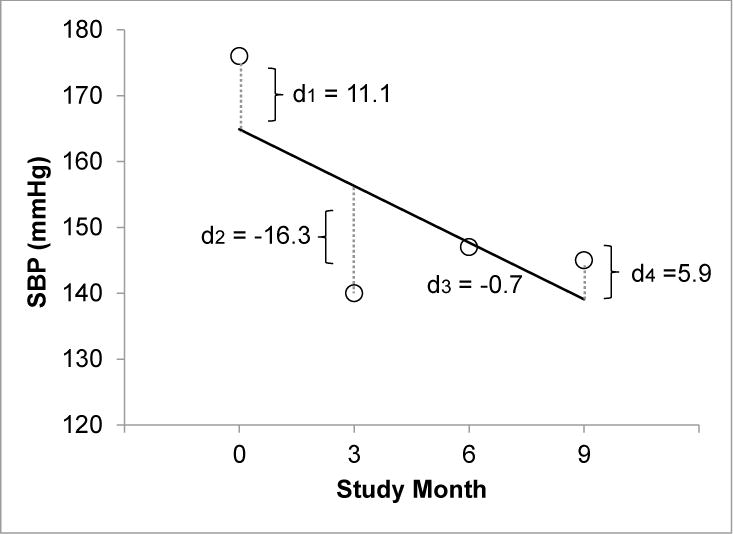
Material and methods: We used an unsupervised cluster procedure to identify distinct patterns of BP change during the first 9 months of anti-hypertensive therapy intensification among 1,331 participants in the Secondary Prevention of Small Subcortical Strokes Trial who were previously randomized to lower BP target (SBP < 130 mm Hg) after lacunar stroke.
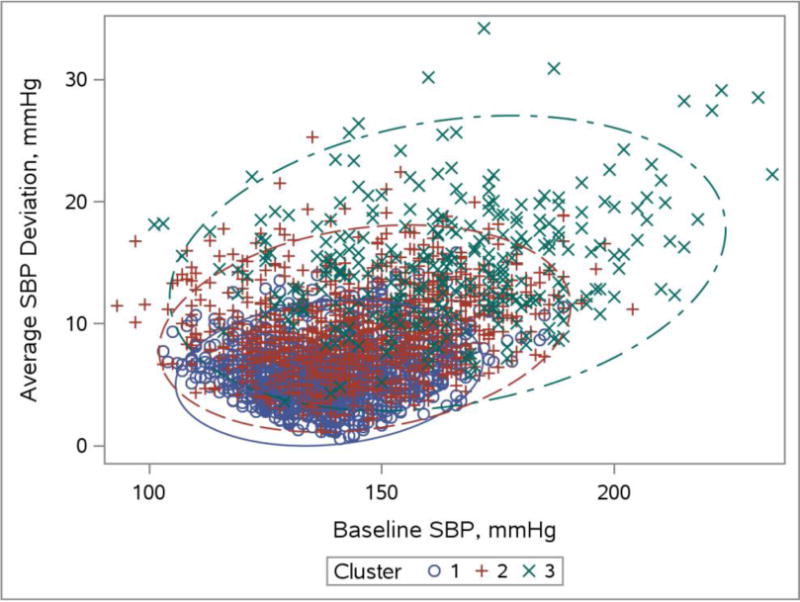
Results: The cluster procedure partitioned participants into three groups in the lower SBP target arm, persons with: 1) mildly elevated baseline SBP and minimal visit-to-visit BP variability (mild reducers); 2) moderately elevated baseline SBP and moderate visit-to-visit BP variability (moderate reducers); and 3) very elevated baseline SBP with very large visit-to-visit BP variability during intensification (large reducers). In the lower SBP target group, moderate reducers had a higher risk of death (adjusted HR 1.6 [95% CI 1.0-2.7]), MVE (adjusted HR 2.1 [95% CI 1.4-3.2]), and stroke (adjusted HR 2.6[95% CI 1.7-4.1]) compared to mild reducers. Large reducers had the highest risk of death (adjusted HR 2.3 [95% CI 1.2-4.4]), but risk of MVE (HR = 1.7 [95%CI 0.9-3.1]) and stroke (HR = 1.6 [95%CI: 0.8-3.5]) were not statistically significantly different compared to mild reducers.
Conclusions: Among persons with prior lacunar stroke, baseline BP levels, and BP variability in the setting of intensive BP lowering can identify discrete groups of persons at higher risk of adverse outcomes.
Keywords: Mortality; hypertension; machine learning.
Conflict of interest statement
Conflicts of interest: None
The other authors report no conflicts
Figures
References
-
- Wang JG, Staessen JA, Franklin SS, et al. Systolic and diastolic blood pressure lowering as determinants of cardiovascular outcome. Hypertension. 2005;45:907–913. - PubMed
-
- Muntner P, Shimbo D, Tonelli M, et al. The relationship between visit-to-visit variability in systolic blood pressure and all-cause mortality in the general population: findings from NHANES III, 1988 to 1994. Hypertension. 2011;57:160–166. - PubMed
Publication types
MeSH terms
Grants and funding
LinkOut - more resources
Full Text Sources
Other Literature Sources
Medical
Miscellaneous