. 2018 Jan 3;12(2):026001.
doi: 10.1088/1752-7163/aa8f7f.

Comprehensive volatile metabolic fingerprinting of bacterial and fungal pathogen groups

Affiliations

Comprehensive volatile metabolic fingerprinting of bacterial and fungal pathogen groups

Christiaan A Rees et al. J Breath Res. .

Abstract

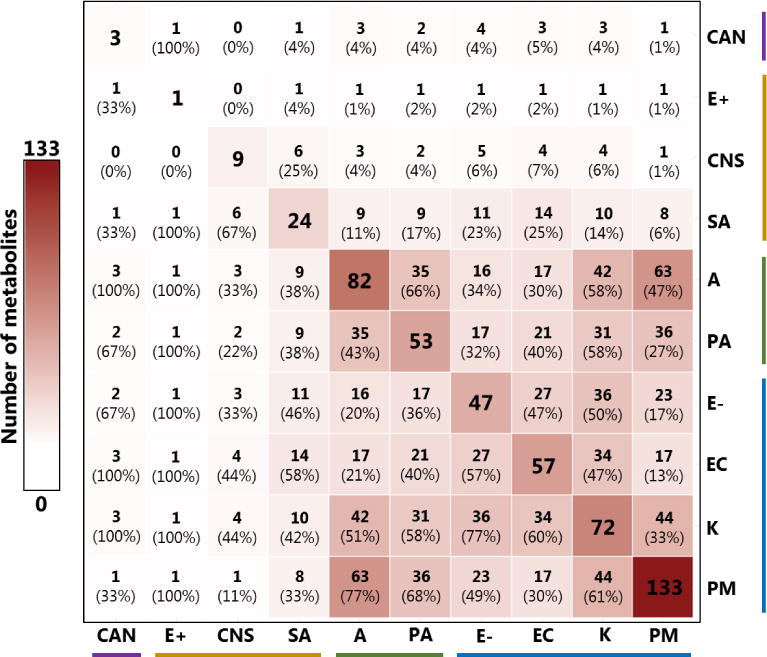
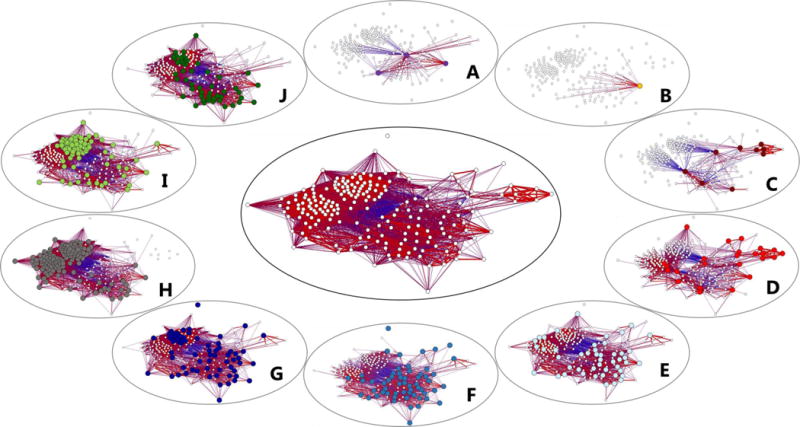
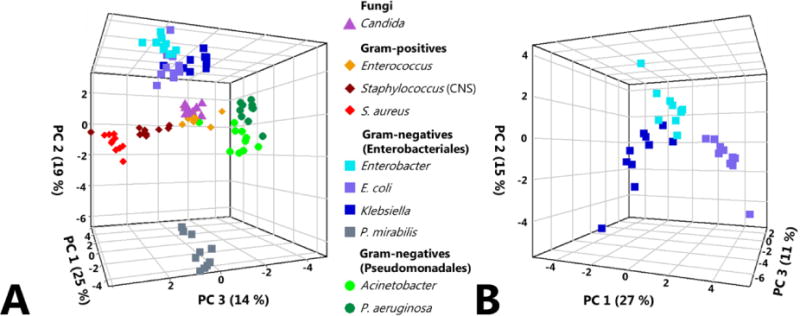
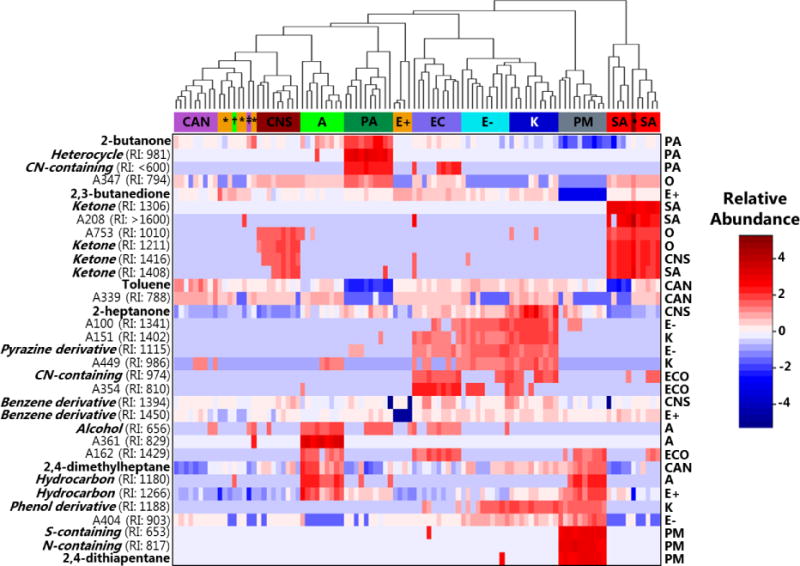
The identification of pathogen-specific volatile metabolic 'fingerprints' could lead to the rapid identification of disease-causing organisms either directly from ex vivo patient bio-specimens or from in vitro cultures. In the present study, we have evaluated the volatile metabolites produced by 100 clinical isolates belonging to ten distinct pathogen groups that, in aggregate, account for 90% of bloodstream infections, 90% of urinary tract infections, and 80% of infections encountered in the intensive care unit setting. Headspace volatile metabolites produced in vitro were concentrated using headspace solid-phase microextraction and analyzed via two-dimensional gas chromatography time-of-flight mass spectrometry (HS-SPME-GC×GC-TOFMS). A total of 811 volatile metabolites were detected across all samples, of which 203 were: (1) detected in 9 or 10 (of 10) isolates belonging to one or more pathogen groups, and (2) significantly more abundant in cultures relative to sterile media. Network analysis revealed a distinct metabolic fingerprint associated with each pathogen group, and analysis via Random Forest using leave-one-out cross-validation resulted in a 95% accuracy for the differentiation between groups. The present findings support the results of prior studies that have reported on the differential production of volatile metabolites across pathogenic bacteria and fungi, and provide additional insight through the inclusion of pathogen groups that have seldom been studied previously, including Acinetobacter spp., coagulase-negative Staphylococcus, and Proteus mirabilis, as well as the utilization of HS-SPME-GC×GC-TOFMS for improved sensitivity and resolution relative to traditional gas chromatography-based techniques.


Figures

Figure 1
Figure 1
Overlap of volatile metabolites across pathogen groups, considering metabolites that were: 1) detected in 9 or 10 (of 10) isolates from a given group, and 2) significantly more abundant in cultures relative to sterile media controls (p < 0.05). Values on the diagonal indicate the number of metabolites detected for each group. Values in parentheses indicate the percentage of volatile metabolites produced by the pathogen group in that cell’s column that were also produced by the pathogen group in that cell’s row. Cell color is proportional to the total number of metabolites detected. CAN: Candida spp.; E+: Enterococcus spp.; CNS: Coagulase-negative Staphylococcus; SA: S. aureus; A: Acinetobacter spp.; PA: P. aeruginosa; E−: Enterobacter spp.; EC: E. coli; K: Klebsiella spp.; PM: P. mirabilis. Colored horizontal and vertical bars denote fungi (purple), Gram-positives (orange), Pseudomonadales (green), and Enterobacteriales (blue).
Figure 2
Figure 2
Network plot depicting 203 volatile metabolites produced by the ten pathogen groups evaluated in this study (center). Smaller, peripheral plots highlight the subset of metabolites produced by each individual pathogen group, with colored nodes corresponding to those metabolites produced by that group. A: Candida spp. (purple); B: Enterococcus spp. (orange); C: Coagulase-negative Staphylococcus (dark red); D: S. aureus (light red); E: Enterobacter spp. (light blue); F: E. coli (medium blue); G: Klebsiella spp. (dark blue); H: P. mirabilis (grey); I: Acinetobacter spp. (light green); J: P. aeruginosa (dark green). Edges indicate either positive (red) or negative (blue) correlations between metabolites, calculated using Pearson’s correlation coefficient. Only significant correlations (p < 0.05 after Benjamini-Hochberg correction) are displayed.
Figure 3
Figure 3
Principal components (PC) scores plots for ten fungal and bacterial pathogen groups, generated using 33 discriminatory volatile compounds identified via Random Forest (RF). 2a, left: PC scores plot depicting all ten pathogen groups. Fungi: triangles; Gram-positive cocci: diamonds; Gram-negative rods (Enterobacteriales): squares; Gram-negative rods (Pseudomonadales): circles. PC1: 25 %, PC2: 19 %, PC3: 14 %. 2b, right: PC scores plot depicting only the three closely-related Enterobacteriales: Enterobacter, E. coli, and Klebsiella, using the same discriminatory volatile compounds for the comprehensive pathogen-level comparison presented in 2a. PC1: 27 %, PC2: 15 %, PC3: 11 %.
Figure 4
Figure 4
Heat map depicting the relative abundance of the 33 discriminatory volatile metabolites identified using RF (rows) across the ten pathogen groups assessed in this study (columns). Dendrogram (top) depicts the relatedness between strains, utilizing Euclidean distance as the distance metric. Cell colors correspond to relative compound abundance after mean-centering and unit-scaling, ranging from blue (low relative abundance) to red (high relative abundance). CAN or ‡: Candida; E+ or *: Enterococcus spp.; CNS or •: Coagulase-negative Staphylococcus; SA: S. aureus; A or †: Acinetobacter spp.; E−: Enterobacter spp.; EC: E. coli; K: Klebsiella spp.; PA: P. aeruginosa; PM: P. mirabilis. Putative compound identifications or class assignments are provided when possible (left). Experimentally-determined retention indices (RIs) are provided for analytes (“A” followed by a number), and metabolites for which only compound class assignments could be determined. The statistical model from which a given metabolite was selected is provided (right), with O representing metabolites selected from the overall (ten-group) comparison.

Similar articles

Cited by

References

    1. Schulz S, Dickschat JS. Bacterial volatiles: the smell of small organisms. Nat Prod Rep. 2007;24:814–42. - PubMed
    1. Bos LD, Sterk PJ, Schultz MJ. Volatile metabolites of pathogens: a systematic review. PLoS Pathog. 2013;9:e1003311. - PMC - PubMed
    1. Martins C, Brandao T, Almeida A, Rocha SM. Metabolomics strategy for the mapping of volatile exometabolome from Saccharomyces spp. widely used in the food industry based on comprehensive two-dimensional gas chromatography. J Sep Sci. 2017;40:2228–2237. - PubMed
    1. Lonsdale CL, Taba B, Queralto N, Lukaszewski RA, Martino RA, Rhodes PA, Lim SH. The use of colorimetric sensor arrays to discriminate between pathogenic bacteria. PLoS One. 2013;8:e62726. - PMC - PubMed
    1. Koo S, Thomas HR, Daniels SD, Lynch RC, Fortier SM, Shea MM, Rearden P, Comolli JC, Baden LR, Marty FM. A breath fungal secondary metabolite signature to diagnose invasive aspergillosis. Clin Infect Dis. 2014;59:1733–40. - PMC - PubMed

Publication types

Substances