. 2017 Sep 27;18(10):2062.
doi: 10.3390/ijms18102062.

Spaceflight Activates Autophagy Programs and the Proteasome in Mouse Liver

Affiliations

Spaceflight Activates Autophagy Programs and the Proteasome in Mouse Liver

Elizabeth A Blaber et al. Int J Mol Sci. .

Abstract

Increased oxidative stress is an unavoidable consequence of exposure to the space environment. Our previous studies showed that mice exposed to space for 13.5 days had decreased glutathione levels, suggesting impairments in oxidative defense. Here we performed unbiased, unsupervised and integrated multi-'omic analyses of metabolomic and transcriptomic datasets from mice flown aboard the Space Shuttle Atlantis. Enrichment analyses of metabolite and gene sets showed significant changes in osmolyte concentrations and pathways related to glycerophospholipid and sphingolipid metabolism, likely consequences of relative dehydration of the spaceflight mice. However, we also found increased enrichment of aminoacyl-tRNA biosynthesis and purine metabolic pathways, concomitant with enrichment of genes associated with autophagy and the ubiquitin-proteasome. When taken together with a downregulation in nuclear factor (erythroid-derived 2)-like 2-mediated signaling, our analyses suggest that decreased hepatic oxidative defense may lead to aberrant tRNA post-translational processing, induction of degradation programs and senescence-associated mitochondrial dysfunction in response to the spaceflight environment.

Keywords: autophagy; metabolomics; proteasome; senescence; spaceflight; tRNA biosynthesis.


Conflict of interest statement

The authors declare no conflict of interest.

Figures

Figure 1
Figure 1
Brief exposure to the space environment results in significant metabolite changes in mouse liver. (A) PLS-DA analysis was performed on normalized metabolomics data that was subsequently log-transformed and auto-scaled. The first two components are plotted; (B) volcano plot comparing flown in space (FLT) vs. matched ground controls (AEM) considering unequal variance and using a fold change (FC) threshold of 2 and a p (corr)-value threshold of 0.05. Data points in red indicate significant named biochemical features. Data points in blue are not significant; (C) heat map and hierarchical clustering performed using a Pearson score for the distance measure, with features organized by VIP score from the PLS-DA analysis. Red—AEM, green—FLT; red indicates compounds with high signal abundance and blue those with low signal abundance. Color intensity correlates with relative signal abundance. n = 6/group.
Figure 2
Figure 2
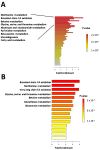
Metabolite set enrichment analysis reveals metabolic pathways enriched in livers of FLT mice. Enrichment analysis was performed in MetaboAnalyst using (A) all metabolites or (B) only metabolites with significantly changing abundances between groups (p < 0.05). n = 5/group. Eighty-eight metabolite sets based on “normal metabolic pathways” were used for the analysis. For clarity of presentation, only the most significantly enriched metabolite sets are annotated.
Figure 3
Figure 3
Increased steatosis and infiltration of inflammatory cells in livers from mice exposed to spaceflight. H&E staining was performed on fixed liver sections from n = 4–5 mice/group to investigate liver histology. Inspection of the H&E stained sections revealed that the AEM ground control mice had small cytoplasmic lipid droplets predominantly located in zone 2 whereas the FLT mice had an increase in slightly larger droplets distributed in a panlobular pattern. Multiple lipid droplets are indicated using white arrows. Furthermore, FLT mice showed increased accumulation of mononuclear inflammatory cells, particularly near portal ducts (yellow arrow). Representative images are shown from each group. PT = portal triad, CV = central vein. Scale bar = 100 μm.
Figure 4
Figure 4
Hepatic gene expression is significantly altered by exposure to the space environment. Profile (A) and scatter (C) plots of all significantly regulated genes (p (corr) < 0.05), and (B) profile plots of biologically significant genes with differential regulation FC +/− 1.5. Red lines (B) and points (C) indicate significantly upregulated genes in AEM mice, whilst blue indicate significantly upregulated genes in FLT. Yellow indicates genes that are statistically but not biologically significant.
Figure 5
Figure 5
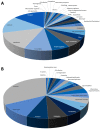
GO biological functions associated with (A) up- and (B) downregulated datasets. Change in regulation was determined as the ratio of average expression of FLT to AEM values for each transcript, n = 6/group.
Figure 6
Figure 6
Integrated enrichment analysis using multi-‘omics datasets from livers of spaceflight mice compared with AEM ground controls. Data were submitted to the MetaboAnalyst Integrated Pathway Analysis module. (A) gene-metabolite; (B) gene and (C) metabolite centric workflows were compared for n = 6 mice per group.
Figure 7
Figure 7
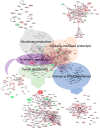
Cluster analysis using EGAN (Exploratory Gene Association Networks) software was performed using all significantly changing transcripts (p < 0.05). Genes associated with the top enriched pathways were clustered using a radial force-driven display. Insets are zoomed out views of each cluster. Only significantly changing genes are included in insets for clarity of presentation. Intensity of color (red = upregulated, green = downregulated, grey = not detected) is associated with degree of fold change and width of the bounding circle is inversely related to p (corr)-value. n = 6 animals per group were used for the analysis.
Figure 8
Figure 8
Autophagy programs are upregulated in livers from spaceflight mice. Cluster analysis using EGAN software was performed using genes associated with autophagy programs generated by BIOMART. Genes were clustered using a radial force-driven display. Intensity of color (red = upregulated, green = downregulated, grey = not detected) is associated with degree of fold change and width of the bounding circle is inversely related to p (corr)-value. n = 6 animals per group were used for the analysis.
Figure 9
Figure 9
NFE2L2/NRF2-mediated pathways are downregulated in spaceflight mouse livers. Ingenuity Pathway Analysis was used for analysis of mRNA transcript levels in livers from FLT and AEM control mice. Grey = unchanged, green = downregulated, red = upregulated. Intensity of color correlates with degree of fold-change. n = 6/group.

References

    1. Meehan R., Whitson P., Sams C. The role of psychoneuroendocrine factors on spaceflight-induced immunological alterations. J. Leukoc. Biol. 1993;54:236–244. - PubMed
    1. Alwood J.S., Kumar A., Tran L.H., Wang A., Limoli C.L., Globus R.K. Low-dose, ionizing radiation and age-related changes in skeletal microarchitecture. J. Aging Res. 2011;2012 doi: 10.1155/2012/481983. - DOI - PMC - PubMed
    1. Cucinotta F.A., Schimmerling W., Wilson J.W., Peterson L.E., Badhwar G.D., Saganti P.B., Dicello J.F. Space radiation cancer risks and uncertainties for mars missions. Radiat. Res. 2001;156:682–688. doi: 10.1667/0033-7587(2001)156[0682:SRCRAU]2.0.CO;2. - DOI - PubMed
    1. Pecaut M.J., Mao X.W., Bellinger D.L., Jonscher K.R., Stodieck L.S., Ferguson V.L., Bateman T.A., Mohney R.P., Gridley D.S. Is spaceflight-induced immune dysfunction linked to systemic changes in metabolism? PLoS ONE. 2017;12:e0174174. doi: 10.1371/journal.pone.0174174. - DOI - PMC - PubMed
    1. Jonscher K.R., Alfonso-Garcia A., Suhalim J.L., Orlicky D.J., Potma E.O., Ferguson V.L., Bouxsein M.L., Bateman T.A., Stodieck L.S., Levi M., et al. Spaceflight activates lipotoxic pathways in mouse liver. PLoS ONE. 2016;11:e0152877. - PMC - PubMed

MeSH terms