. 2017 Oct 5;550(7674):74-79.
doi: 10.1038/nature23912. Epub 2017 Sep 27.

Massively parallel de novo protein design for targeted therapeutics

Affiliations

Massively parallel de novo protein design for targeted therapeutics

Aaron Chevalier et al. Nature. .

Abstract

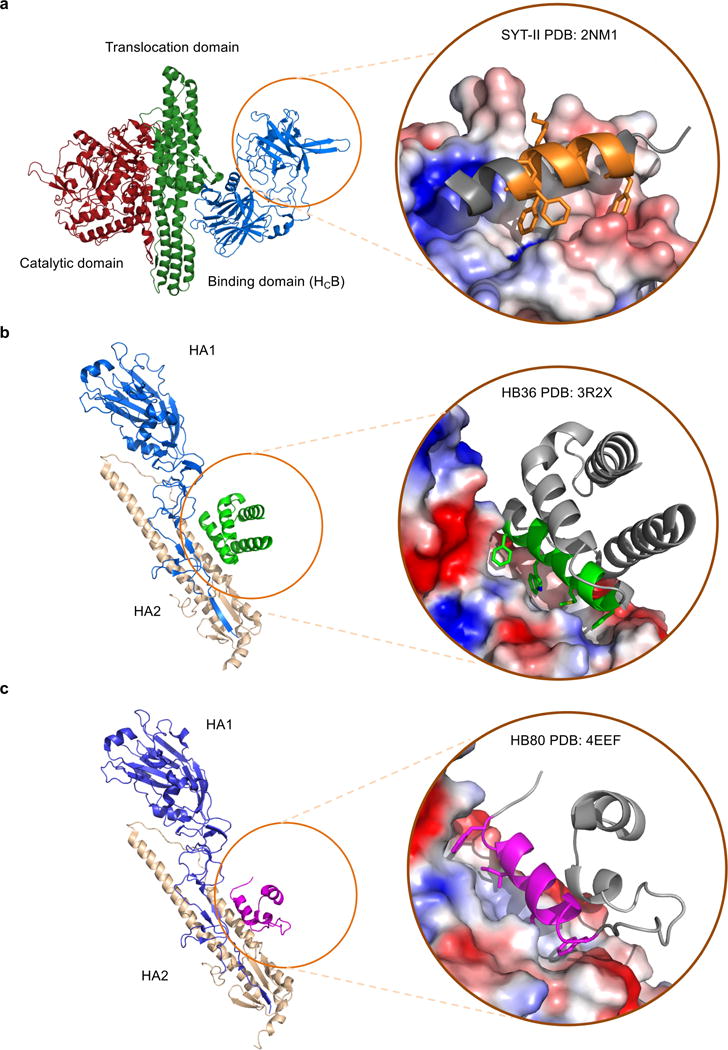
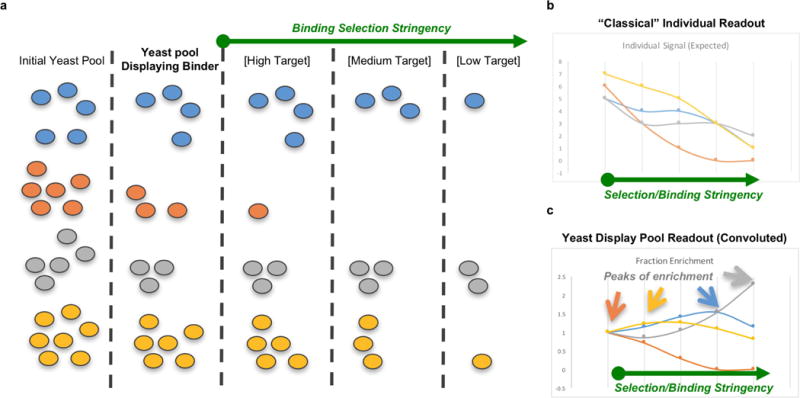
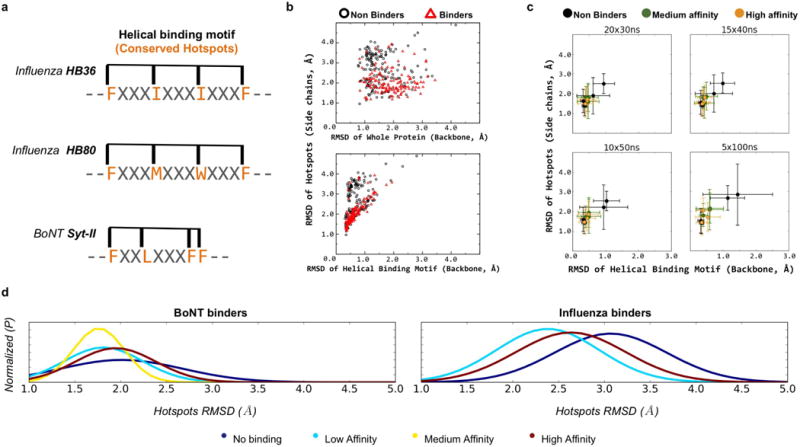
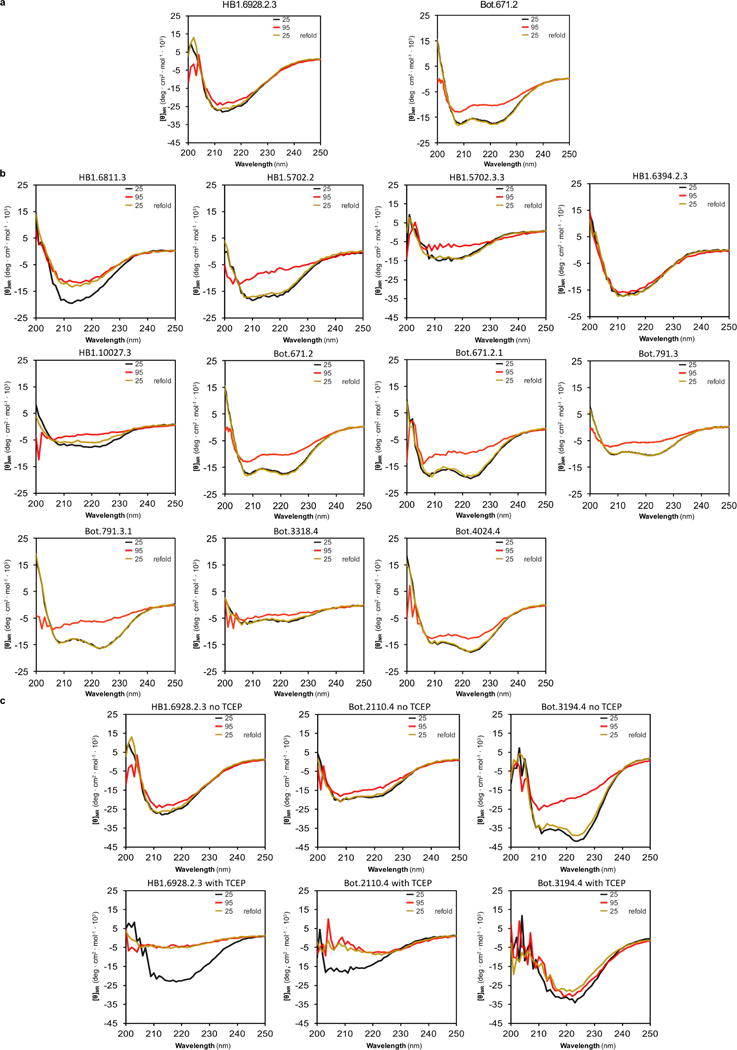
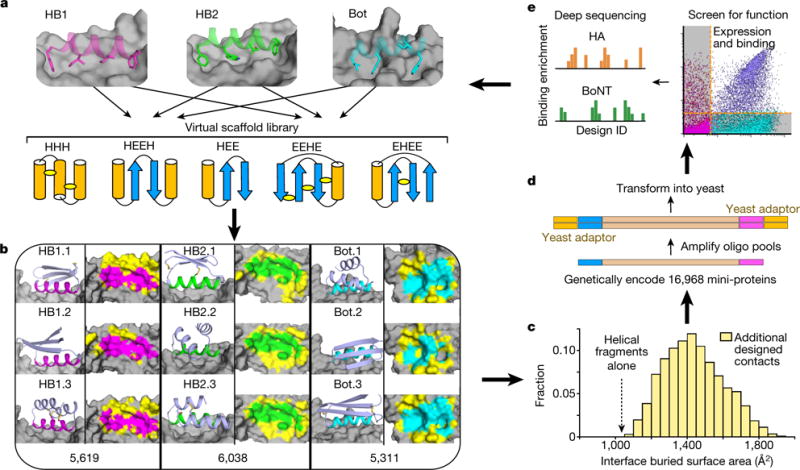
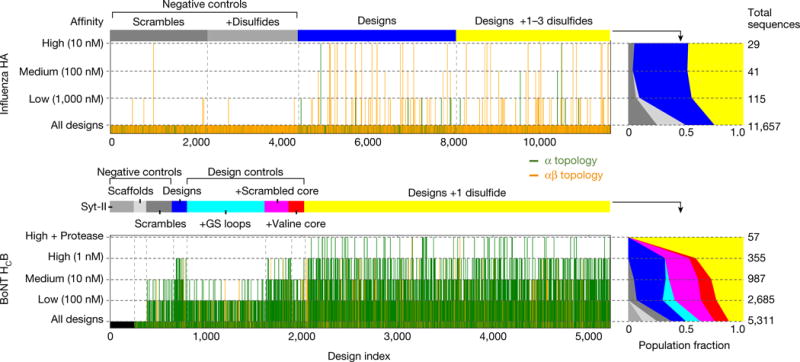
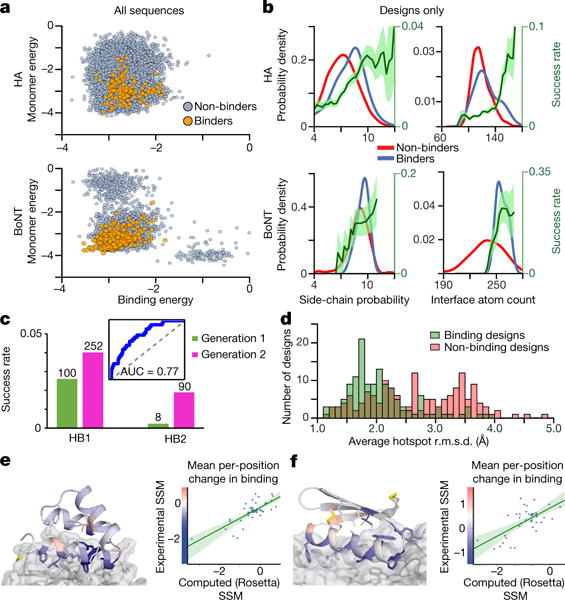
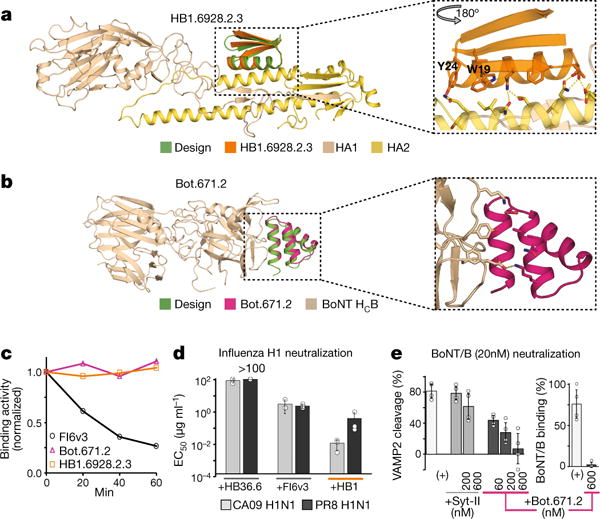
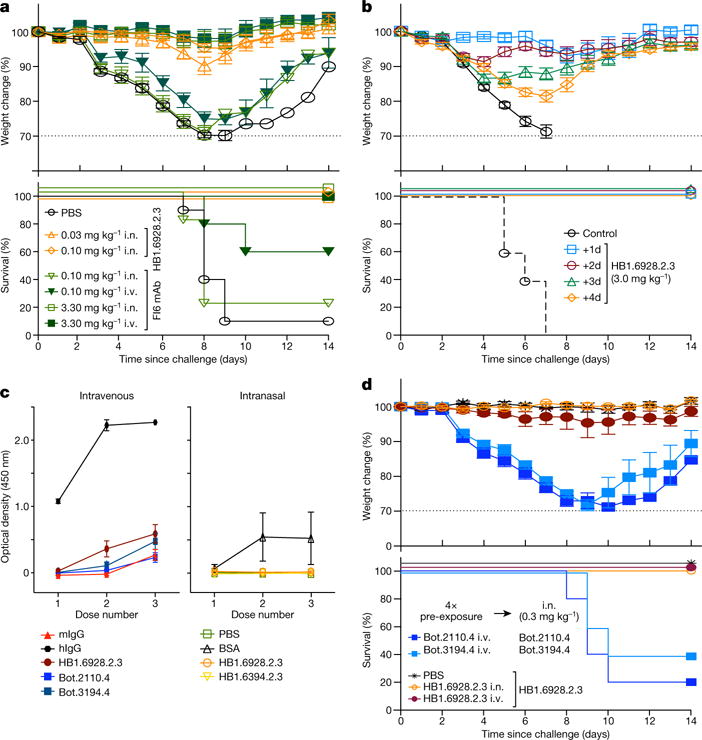
De novo protein design holds promise for creating small stable proteins with shapes customized to bind therapeutic targets. We describe a massively parallel approach for designing, manufacturing and screening mini-protein binders, integrating large-scale computational design, oligonucleotide synthesis, yeast display screening and next-generation sequencing. We designed and tested 22,660 mini-proteins of 37-43 residues that target influenza haemagglutinin and botulinum neurotoxin B, along with 6,286 control sequences to probe contributions to folding and binding, and identified 2,618 high-affinity binders. Comparison of the binding and non-binding design sets, which are two orders of magnitude larger than any previously investigated, enabled the evaluation and improvement of the computational model. Biophysical characterization of a subset of the binder designs showed that they are extremely stable and, unlike antibodies, do not lose activity after exposure to high temperatures. The designs elicit little or no immune response and provide potent prophylactic and therapeutic protection against influenza, even after extensive repeated dosing.


Conflict of interest statement

The authors declare competing financial interests: details are available in the online version of the paper. Readers are welcome to comment on the online version of the paper.

Figures

Extended Data Figure 1
Extended Data Figure 1. Target proteins architecture and interactions with anti-BoNT/B and anti-influenza motifs
a, Full complex of BoNT, showing heavy chain binding domain (HCB) target epitope position in relation to catalytic and translocation domains. Inset shows inhibitory fragment Syt-II (in orange) bound to HCB with hotspots shown as sticks, and grey areas excluded from design calculations. b, Crystal structure of SC1918/H1 showing HA1 and HA2 subunits in complex with HB36.3. Inset shows detailed view of HB36.3 (in green) bound to stem region epitope with hotspots shown as sticks, and grey areas excluded from design calculations. c, Crystal structure of SC1918/H1 showing HA1 and HA2 subunits in complex with HB80.4. Inset shows detailed view of HB80.4 (in magenta) bound to stem region epitope with hotspots shown as sticks, and grey areas excluded from design calculations.
Extended Data Figure 2
Extended Data Figure 2. Categorization of binders from high- throughput sequencing data of yeast-display FACS-sorted yeast pools
a, Schematic representation of a resulting yeast pool experiment transformed with four genes, corresponding to four different binder designs (colours: blue, orange, grey, yellow). The first column represents the initial yeast pool, which presents some variability in the initial number of cells transformed with each gene. Subsequently, the cells are subject to different stringencies of selection condition (display, high, medium and low target concentrations). The number of cells selected during FACS (see Methods) is proportional to both the binding affinity and the fractional population of the design. b, Instead of observing a ‘classical’ readout where each measurement is directly proportional to the amount of binding, the result is a convoluted readout (using high-throughput sequencing of each FACS of selected yeast pools under different conditions, see Methods) of both the population fraction and the binding strength. c, Our method of analysing the strength of an individual design is to assign each of them to a binding condition (category) if they produce a peak in its enrichment (as compared to its own initial population in the unselected, but displaying, population). Since, at higher categories, ‘better’ binders will always out-compete weaker ones, this method clusters binders into categories of binding (for example, weak, medium, or strong). If protease is used to further select the populations for stability, the same concept applies (see Fig. 2).
Extended Data Figure 3
Extended Data Figure 3. Molecular dynamics simulations to assess the flexibility of mini-protein binder designs, their binding motifs and hotspots
a, Schematic representations of the helical segments and hotspots used to calculate the average r.m.s.d. for mini-protein binders containing binding motifs from HB36, HB80 and Syt-II. The four conserved hotspots (orange) used to calculate the average r.m.s.d. of each binding motif are also shown. b, Top, average r.m.s.d.s (with respect to the designed bound conformation) of the whole mini-proteins versus those of the hotspots. The results for non-binders and binders are shown in black and red, respectively. Bottom panel, same as top, except that the x-axis displays the r.m.s.d.s of the entire helical motif. These results were obtained from an aggregation of 108 μs molecular dynamics simulations, from a representative sample of designs (143 for BoNT and 146 for influenza, see Methods for details). The r.m.s.d. values for hotspot residues were calculated using a subset of side-chain heavy atoms that are invariant to the rotation of the aromatic ring (CG and CZ for Phe and Tyr). The backbone heavy atoms were used for the r.m.s.d. calculations of ‘binding helical motif’ and ‘whole protein’. c, The convergence of molecular dynamics simulations discriminates binders and non-binders as a function of simulation length (30 ns, 40 ns, 50 ns and 100 ns), subject to a similar amount of total sampling. The results show that simulations of 50 ns in duration are sufficient to discriminate the stability of binders and non-binders, even though longer molecular dynamics simulations (such as 100 ns) may further improve the discrimination power. Ten randomly selected mini-proteins designed against BoNT (which are also included in b) were used in this figure. d, Similar to Fig. 3d, the normalized traces of the histograms (fitted using a normal probability density function) show that, for both targets, the designs that are binders (cyan, yellow and red lines) show trends with smaller fluctuations in hotspot residues than non-binders (blue lines); however, no particular trend is observed regarding strength of binding.
Extended Data Figure 4
Extended Data Figure 4. Circular dichroism studies
a, Designed mini-proteins that were co-crystallized in complex with their respective targets (as shown in Fig. 4). Designed anti-HA mini-protein HB1.6928.2.3 does not denature up to a temperature of 95 °C. Designed anti-BoNT/B mini-protein shows partial denaturation at 95 °C that is completely reversible after fast-cooling to 25 °C. Black shows the circular dichroism spectrum at 25 °C, red at 95 °C, and yellow at 25 °C (after fast refolding, 5 min). Proteins were measured at 0.25 mg ml−1 in PBS buffer pH 7 (see Methods). b, Proteins that were solubly expressed or chemically synthesized. Plots are analogous to a. HB1.10027.3 contains two disulfides, HB1.6394.2.3 contains three disulfides, Bot.6782.4, Bot.6827.4, Bot.7075.4, Bot.4024.4, Bot.3318.4, Bot.5721.4, and Bot.5916.4, each contain one disulfide bond. The rest of the proteins were designed without disulfide bonds. c, Three disulfide-containing proteins with and without reducing agent. Plots are analogous to a. Proteins were measured at 0.25 mg ml−1 in PBS buffer pH 7 without (top row) and with (bottom row) the reducing agent TCEP. The disulfides are shown to be crucial for the thermal stability of these disulfide-containing proteins (HB1.6928.2.3 contains two disulfides, Bot.2110.4 and Bot.3194.4 each contain one disulfide).
Extended Data Figure 5
Extended Data Figure 5. Trypsin resistance of HA binders
Chemically synthesized HA binder (0.3 mg ml−1) was incubated in PBS with various dilutions of trypsin (52 μM stock) for 20 min at room temperature. Reactions were quenched with addition of 1% weight per volume BSA and samples run on SDS–PAGE gel. The relative concentrations of trypsin are shown at the top. ImageJ was used to quantify the intensity of each band (below the band). a, Both HB36.6 and HB1.5702.3 show weaker gel bands at trypsin concentrations higher than 0.055 stock (2.86 μM), indicating proteolytic degradation. HB1.6928.2 and HB1.6394.2, both of which contain disulfides, show no degradation at any trypsin concentration. b, Scatter plot of gel intensities in a.
Extended Data Figure 6
Extended Data Figure 6. Omit map of HB1.6928.2.3
a, A simulated annealing FOFC omit map for HB1.6928.2.3 (green) residues 10–22 (contoured at 3σ) shows clear density for amino-acid side chains at the interface (dark blue HA1, light blue HA2). A single residue (Asn32), in a loop between the first and second β–strands, is not observed in the electron density. b, 2FO–FC map for Bot.671.2 (green) residues 2–13 (contoured at 2σ) shows clear density for side chains at the interface except for the flexible lysine residue. BoNT HCB is shown in dark blue. The entire backbone, interface, and core residues for Bot.671.2 are all well resolved in the electron density map.
Extended Data Figure 7
Extended Data Figure 7. In vitro neutralization of BoNT/B
a, b, Immunoblots of cultured primary rat cortical neurons that were exposed to BoNT/B (20 nM) or BoNT/A (10 nM) with or without GST–Syt-II or Bot.671.2 (see Methods). The supernatants of lysed neurons were collected for immunoblot analysis to detect the indicated proteins, and actin served as control for loading. The designed mini-protein appears to confer protection against degradation of VAMP2, but not against degradation of the negative control, SNAP25 (the intracellular target of BoNT/A). c, Immunocytochemistry for detection of BoNT/B in neurons (see Methods). Left, negative control (no toxin); middle, positive control (cells incubated with 20 nM of BoNT/B for 10 min); right, near-total protective effect against 20 nM of BoNT/B conferred by co-incubating the cells with 600 nM of the design Bot.671.2. Top panels show a representative image of fluorescence microscopy for the detection of BoNT/B; bottom panels show backfield illumination microscopy for the same area.
Extended Data Figure 8
Extended Data Figure 8. In vitro neutralization of influenza
Comparison of in vitro neutralization of influenza viruses by HB36.6, FI6v3 and the designed mini-protein HB1.6928.2.3. Each antiviral was compared for its efficiency (EC50) in inhibiting the infection of Madin– Darby canine kidney cells by a range of influenza strains. It is clear that HB1.6928.2.3 most efficiently inhibited infection for all of the group-1 influenza strains tested (H1N1, H5N1 and H6N2). As expected, no neutralization was observed against H3N2 (group 2). In all experiments, n = 3 independent samples were tested for each condition, except for T/Mass/1965 (H6N2) and HK/ X31 (H3N2), for which n = 2 samples were tested. Dots show raw values for independent tests and whiskers show ± 1 s.d.
Figure 1
Figure 1. Massively parallel binding protein design
a, Hundreds of 37–43 residue mini-protein backbones with different secondary structure elements, orientations and loop lengths were matched with hotspot binding motifs for HA (HB1 and HB2) and BoNT (Bot) by identifying compatible mini-protein local backbone segments, superimposing them onto the hotspot motif-target complex, and discarding docks with mini- protein/target backbone clashes. Each topology included designs with many different disulfide configurations; several possibilities are illustrated. b, For each non-clashing dock of each scaffold onto each target, the monomer and interaction energies were optimized with Rosetta sequence design. Representative models are shown at the left of each column. Right columns show a top view of the target with the hotspot interaction areas coloured as above and new contact areas generated by Rosetta sequence design coloured yellow; the total number of unique designs generated is indicated at the bottom. c, Designed contacts substantially increase the interface buried surface area of the designs beyond the starting hotspot residues. d, Genes encoding 16,968 mini-protein designs, including 6,286 controls, were synthesized using DNA oligo pool synthesis (see Methods). e, The oligo pools were recombined into yeast display vectors and transformed into yeast (see Methods), and binding of the designs HA or BoNT at different concentrations was assessed by FACS. For each sorting condition, enriched designs were identified by comparing the frequencies in the original and sorted populations using deep sequencing. These data were used to guide improvement of the computational design model, and the entire design, synthesis and testing cycle was iterated
Figure 2
Figure 2. Massively parallel evaluation of binding
Vertical bars indicate FACS binding enrichment at different target concentrations for each of the 16,968 designs and 6,286 controls for Influenza H1 HA (a) and BoNT HCB (b). All α-helical designs are in green; mixed α-β topologies, in orange. The mini-proteins are grouped by type as indicated by the horizontal bars and text at the top of the panels. ‘High+Protease’ indicates 5 min incubation with trypsin (18.5 μg ml−1) followed by incubation with 1 nM target. Right panels indicate normalized population fraction of each type of design (colour scheme as in corresponding left panel) for each of the selection conditions at the far left (Extended Data Table 2); the total number of surviving designs is indicated by the numbers at the far right. For example, after incubation of the HA mini-protein population with 100 nM HA, FACS and deep sequencing, the population fractions of both non-disulfide (blue) and disulfide (yellow) designs doubled compared to the starting population, while that of the non-disulfide scrambles decreased approximately fivefold and the disulfide scrambles completely disappeared
Figure 3
Figure 3. Experiment-based assessment of computational models
a, Computed energies of folding and binding for binding designs (orange) and non-binding designs (grey); x-axis is binding energy per nm2 and y-axis is monomer (folding) energy per residue, both in kcal per mol. b, Kernel density estimates for HA (top) and BoNT (bottom) show that designs that bind target (blue) have better local sequence-structure compatibility, quantified by the Rosetta side-chain probability score -p_aa_pp, and higher interface atom counts than non-binding designs (red). Design success rate (dark green) is shown with 1σ confidence interval (light green). c, Inset: Receiver–operator characteristic curve for discriminating first generation HA binders using a five-factor logistic regression. A second generation of HA binder design incorporating filtering on these five features (see Methods) had an increased success rate (y-axis); the numbers of successes are indicated above the bars. d, Interface residue fluctuations in molecular dynamics simulations are smaller for binding designs than non-binders (see Methods and Extended Data Fig. 3). e, f, Left, design models of Bot.671.2 (e) and HB1.6928.2.3 (f) bound to their targets, coloured by the mean change in binding at each position in the comprehensive mutagenesis pools; conserved residues (blue) are shown as sticks, non-conserved positions in red. Right, the experimentally observed mean changes in binding at each position (y-axis) correlate with those computed from the structures (x-axis) (Pearson cross-correlation test: e, r = 0.76; f, r = 0.64).
Figure 4
Figure 4. Characterization of structure, stability and activity of designs
a, Left, comparison of design model with X-ray structure of HB1.6928.2.3 in complex with PR8 H1 HA (HA used in design calculations is essentially identical to crystal structure and not shown). Right, close-up of the HB1.6928.2.3 X-ray structure with designed residues conserved in the SSMs outside of the hotspot seed indicated in sticks; these residues make both packing (e.g. W19 and Y24) and electrostatic interactions with HA. b, Left, as in a, but for Bot.671.2 in complex with BoNT HCB. c, Binding activity remaining following incubation of the indicated molecules at 80 °C for different durations (x-axis), measured by biolayer interferometry. The designs are considerably more robust than the mAb FI6v3 antibody. d, HB1.6928.2.3 (HB1) more effectively prevents influenza infection of Madin-Darby canine kidney cells than do FI6v3 or the previously designed binder HB36.6 (see also Extended Data Fig. 8). n = 3 independent virus titrations were performed for each condition. Dots show raw values for each test and whiskers show ± 1 s.d. e, Bot.671.2 better protects cultured rat cortical neurons against degradation of VAMP2 than does Syt-II, and it prevents binding of the toxin to neurons. n = 4 independent samples for each condition, dots show raw values for each condition and whiskers show ± 1 s.d.
Figure 5
Figure 5. In VIVO efficacy and immunogenicity
a, b, d, Weight change (top) and survival (bottom) of BALB/c mice receiving influenza binder. a, Prophylactic efficacy: mice received HB1.6928.2.3 (orange) or FI6v3 mAb (green) intranasally or intravenously 24 h before challenge with 2 MLD50 (fifty per cent mouse lethal dose) of H1N1 CA09 virus (n = 10, except 0.03 mg kg−1, n = 5), see also Supplementary Fig. 6. b, Therapeutic efficacy: mice were first challenged with 2 MLD50 of CA09 virus and then received HB1.6928.2.3 intranasally 1–4 days post-challenge (n = 5). The mini-proteins have remarkable therapeutic efficiency even if administered after three days. c, Immune (IgG) responses in BALB/c mice (n = 5) that received three intravenous doses (3 mg kg−1) of miniproteins, human IgG (hIgG) or mouse IgG (mIgG) spaced three weeks apart (left) or three intranasal doses of mini-proteins or bovine serum albumin (BSA; 3 mg kg−1) spaced two weeks apart (right). IgG responses in both cases were measured by enzyme-linked immunosorbent assay (ELISA, 1:500 serum) two weeks after each dose. d, Prophylactic efficacy is not reduced by repeated dosing: Mice received four doses (weeks 0, 3, 6, and 12, 3 mg kg−1) of either HB1.6828.3.2, a Bot protein (mock dosing controls), or buffer (PBS), followed by a fifth intranasal dose of HB1.6828.3.2 or a Bot protein (0.3 mg kg−1) nine days after the fourth administration. Twenty-four hours after the fifth dose, mice were challenged with 2 MLD50 of H1N1 CA09 flu virus. HB1.6928.2.3 remains equally protective after repeated administration when compared to protection with no prior dosing. In all panels, whiskers show ± 1 s.e.m. Raw data for all the experiments in this figure are available in the Supplementary Information. i.n., intranasal; i.v., intravenous

References

    1. Kintzing JR, Cochran JR. Engineered knottin peptides as diagnostics, therapeutics, and drug delivery vehicles. Curr Opin Chem Biol. 2016;34:143–150. - PubMed
    1. Gebauer M, Skerra A. Engineered protein scaffolds as next-generation antibody therapeutics. Curr Opin Chem Biol. 2009;13:245–255. - PubMed
    1. Zahnd C, et al. Efficient tumor targeting with high-affinity designed ankyrin repeat proteins: effects of affinity and molecular size. Cancer Res. 2010;70:1595–1605. - PubMed
    1. Vazquez-Lombardi R, et al. Challenges and opportunities for non-antibody scaffold drugs. Drug Discov Today. 2015;20:1271–1283. - PubMed
    1. Bhardwaj G, et al. Accurate de novo design of hyperstable constrained peptides. Nature. 2016;538:329–335. - PMC - PubMed

Publication types

MeSH terms

Substances