. 2017 Oct 5;550(7674):119-123.
doi: 10.1038/nature24022. Epub 2017 Sep 27.

Inflammasome-driven catecholamine catabolism in macrophages blunts lipolysis during ageing

Affiliations

Inflammasome-driven catecholamine catabolism in macrophages blunts lipolysis during ageing

Christina D Camell et al. Nature. .

Abstract

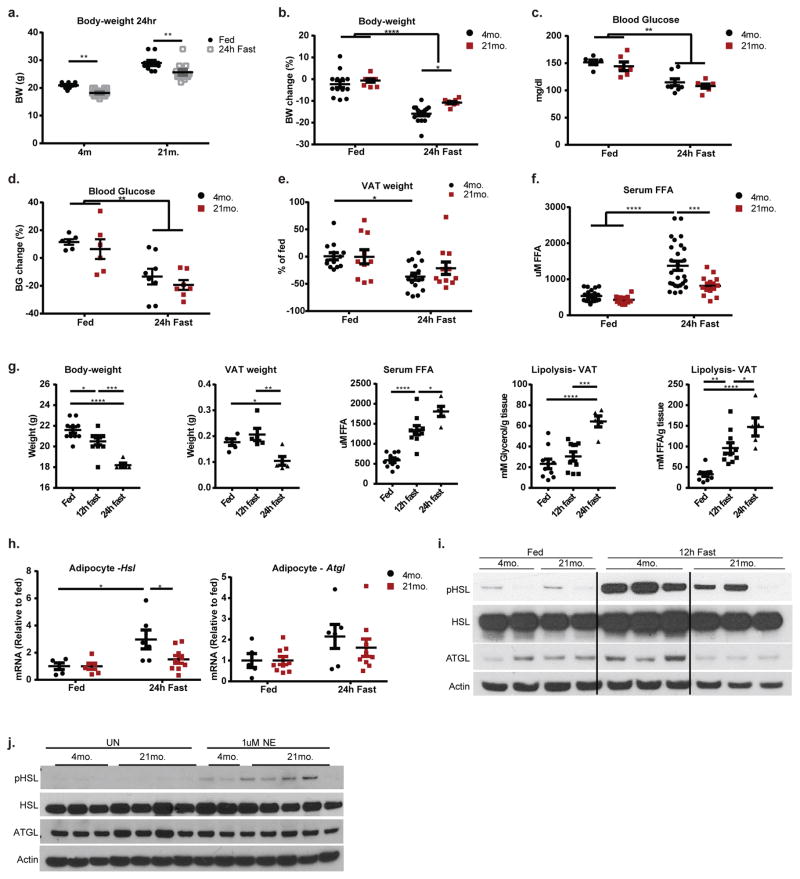
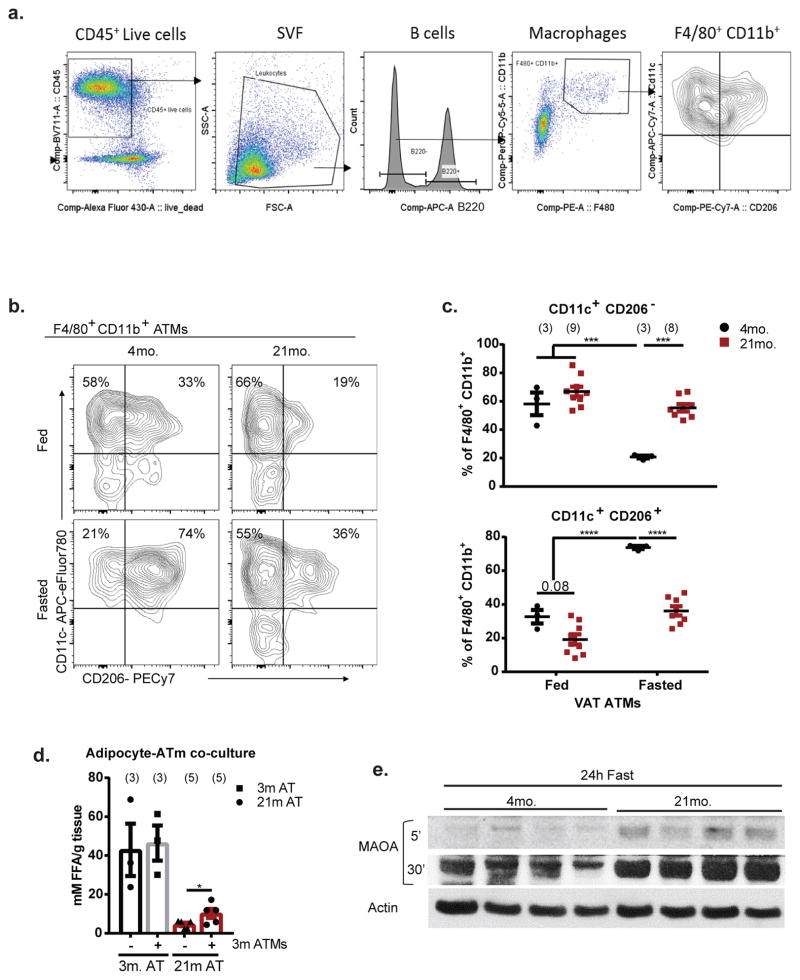
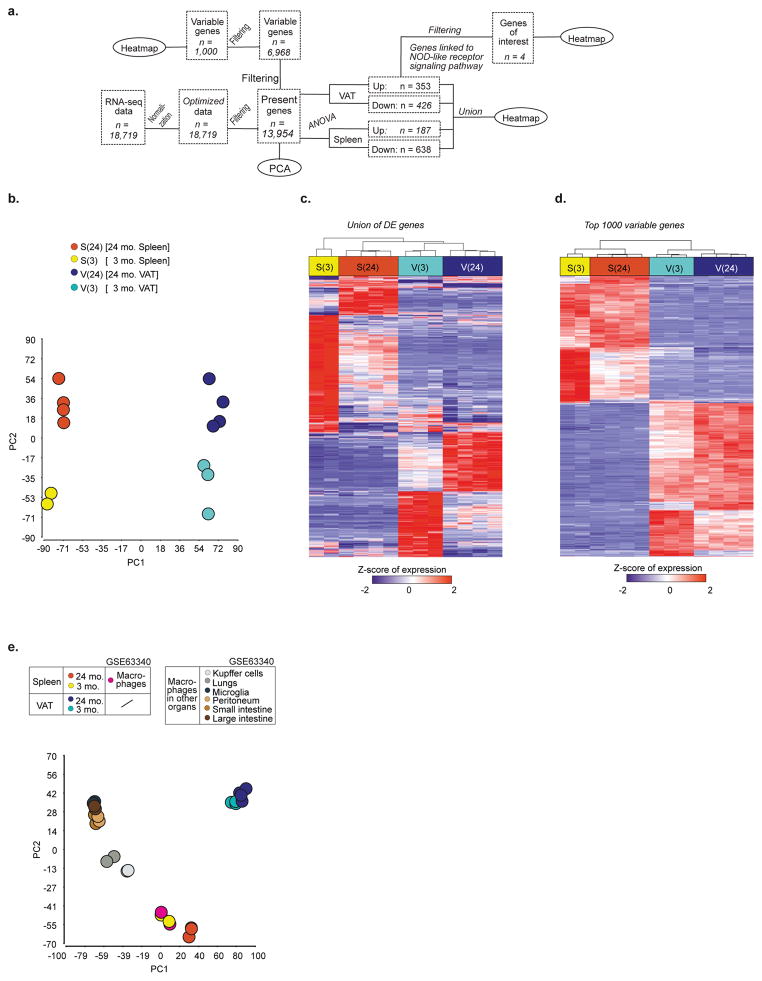
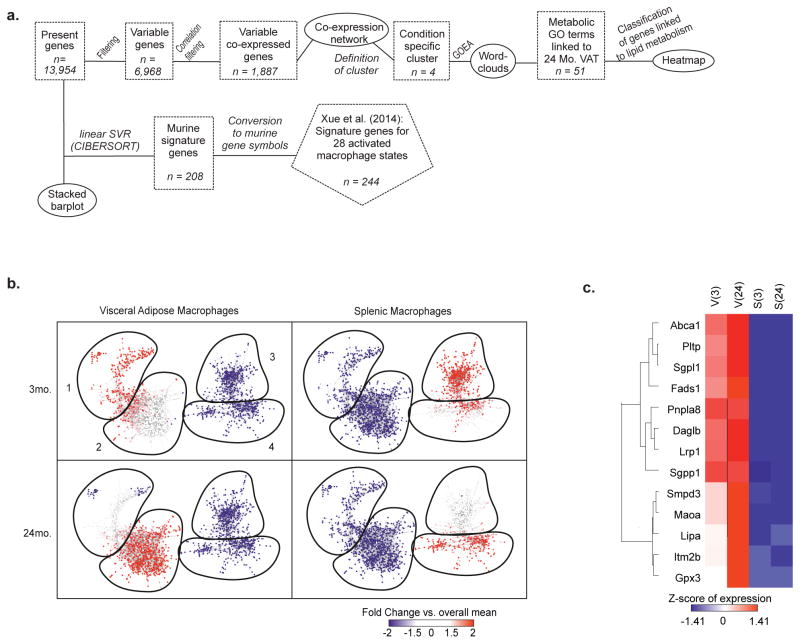
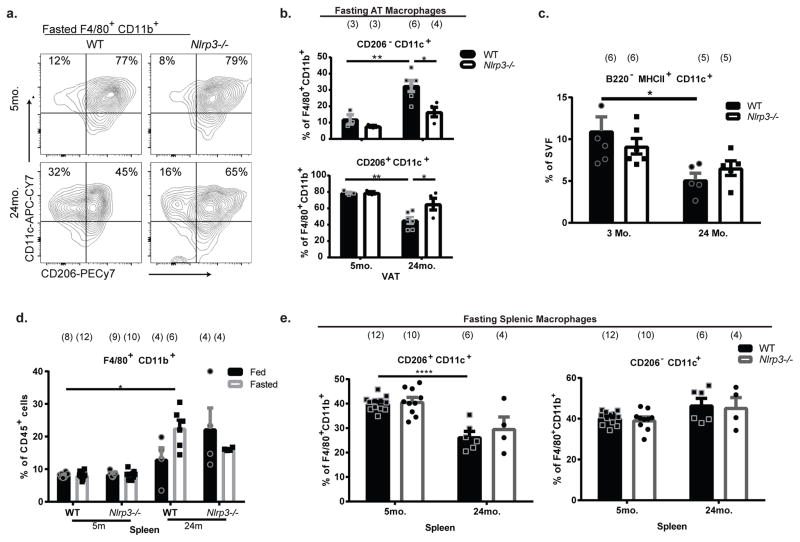
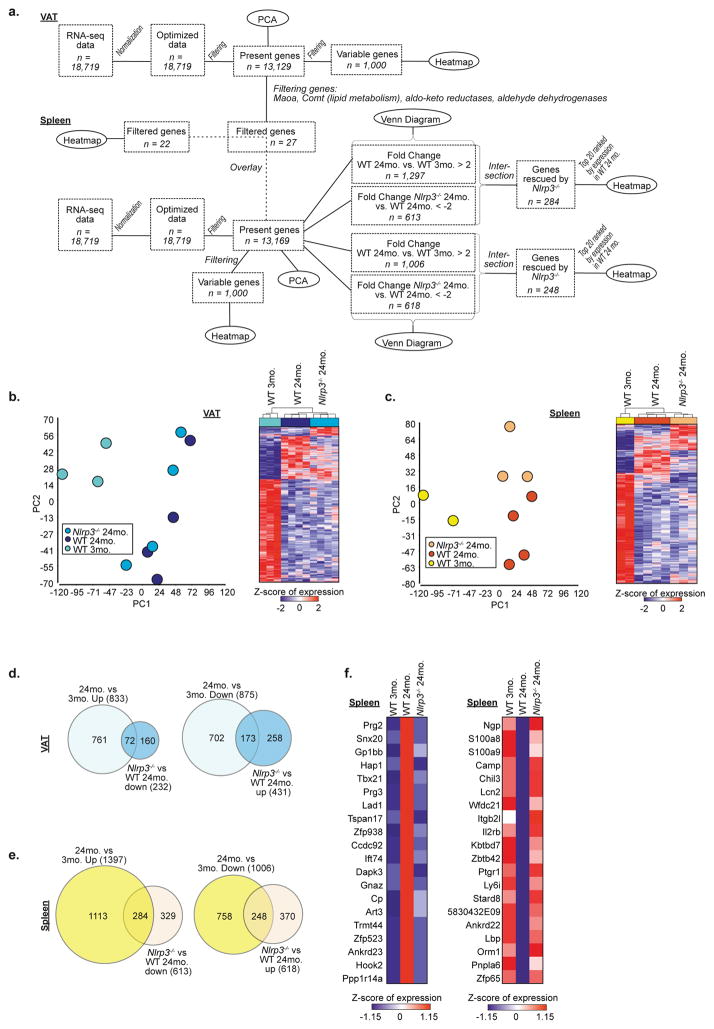
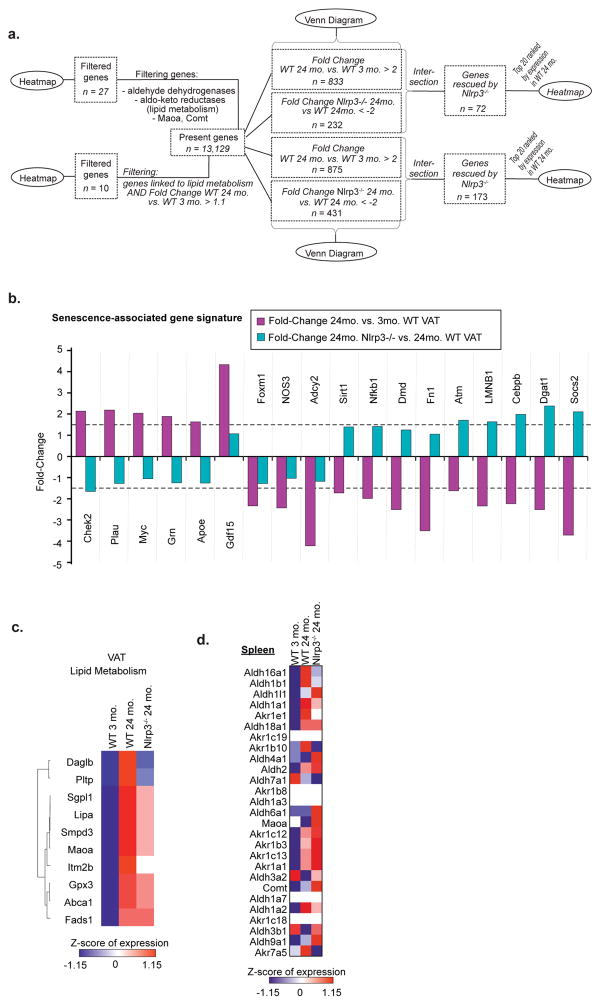
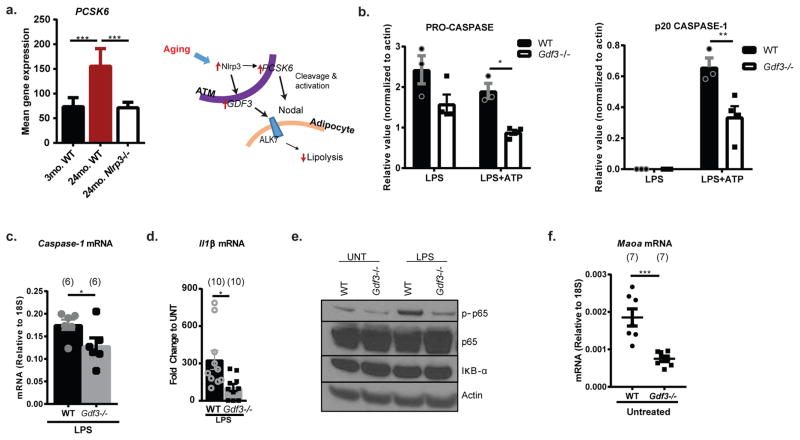
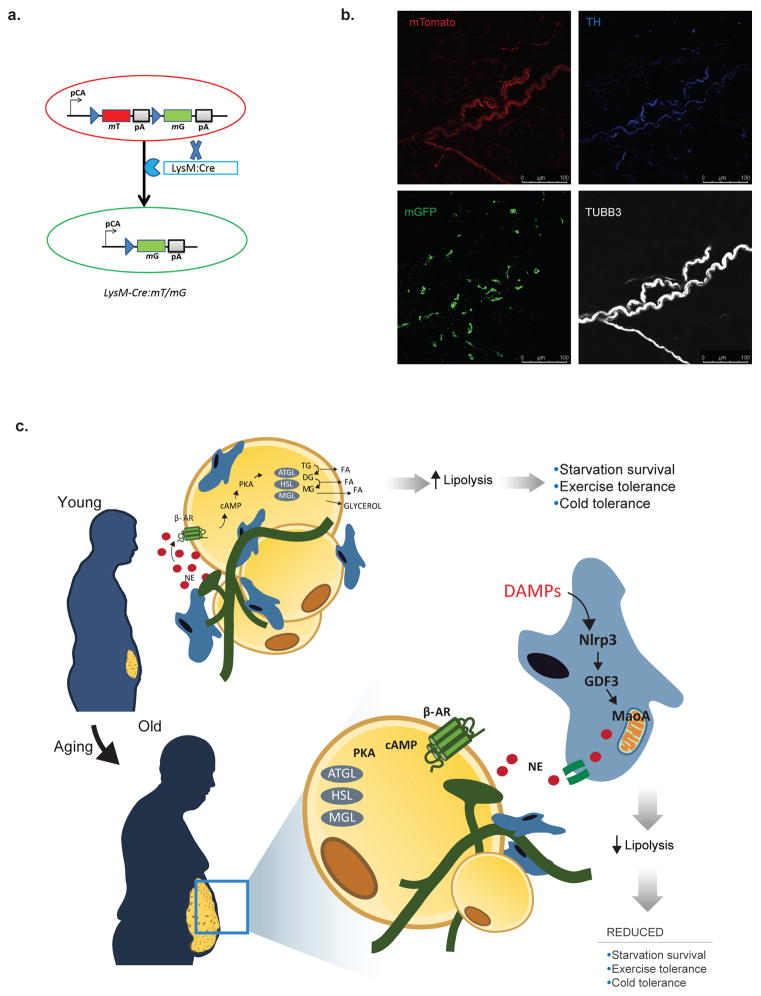
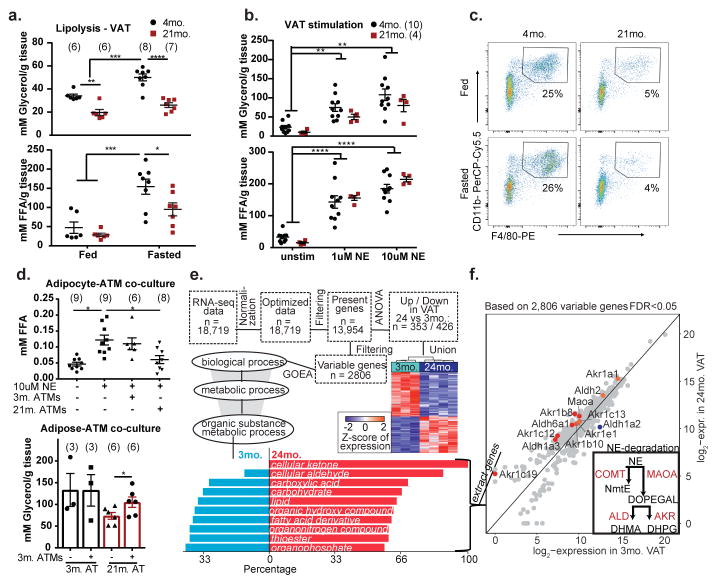
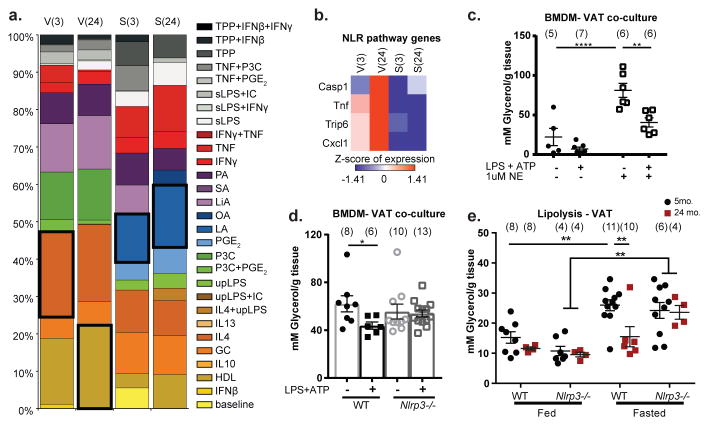
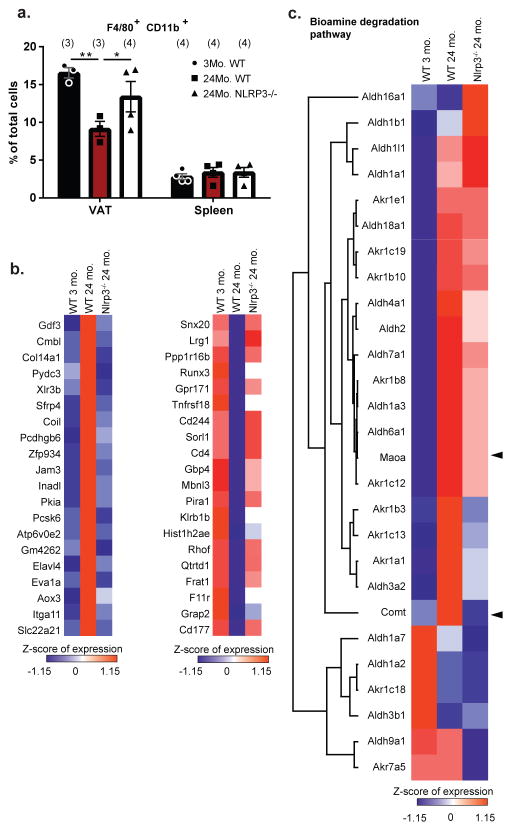
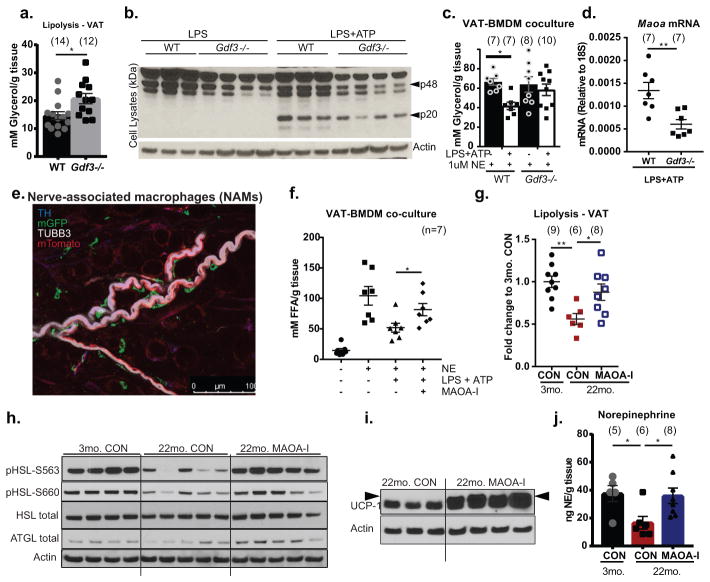
Catecholamine-induced lipolysis, the first step in the generation of energy substrates by the hydrolysis of triglycerides, declines with age. The defect in the mobilization of free fatty acids in the elderly is accompanied by increased visceral adiposity, lower exercise capacity, failure to maintain core body temperature during cold stress, and reduced ability to survive starvation. Although catecholamine signalling in adipocytes is normal in the elderly, how lipolysis is impaired in ageing remains unknown. Here we show that adipose tissue macrophages regulate the age-related reduction in adipocyte lipolysis in mice by lowering the bioavailability of noradrenaline. Unexpectedly, unbiased whole-transcriptome analyses of adipose macrophages revealed that ageing upregulates genes that control catecholamine degradation in an NLRP3 inflammasome-dependent manner. Deletion of NLRP3 in ageing restored catecholamine-induced lipolysis by downregulating growth differentiation factor-3 (GDF3) and monoamine oxidase A (MAOA) that is known to degrade noradrenaline. Consistent with this, deletion of GDF3 in inflammasome-activated macrophages improved lipolysis by decreasing levels of MAOA and caspase-1. Furthermore, inhibition of MAOA reversed the age-related reduction in noradrenaline concentration in adipose tissue, and restored lipolysis with increased levels of the key lipolytic enzymes adipose triglyceride lipase (ATGL) and hormone sensitive lipase (HSL). Our study reveals that targeting neuro-immunometabolic signalling between the sympathetic nervous system and macrophages may offer new approaches to mitigate chronic inflammation-induced metabolic impairment and functional decline.


Conflict of interest statement

The authors declare no competing financial interests.

Figures

Extended data Figure 1
Extended data Figure 1. Age-related AT defects in response to fasting, related to Figure 1
a, Body-weight after 24h feeding or fasting. Each symbol represents an individual mouse. Data are represented as mean±SEM. N= (13) 4-month fed; (10) 21-month fed; (16) 21-month fast; (11) 21-month fast pooled from 2 independent experiments. b, Percent body-weight change after 24 hour fasting. Each symbol represents an individual mouse. Data are represented as mean±SEM. N= (13) 4-month fed; (10) 21-month fed; (16) 21-month fast; (11) 21-month fast pooled from 2 independent experiments. c, Blood glucose, each symbol represents an individual mouse. Data are represented as mean±SEM. N= (6) 4-month fed; (6) 21-month fed; (8) 21-month fast; (7) 21-month fast. d, Percentage change in blood glucose after feeding or fasting. Each symbol represents an individual mouse. Data are are represented as mean±SEM. N= (6) 4-month fed; (6) 21-month fed; (8) 21-month fast; (7) 21-month fast. e, VAT weight, displayed as a percentage of fed. Each symbol represents an individual mouse. Data are represented as mean±SEM. N= (13) 4-month fed; (10) 21-month fed; (16) 21-month fast; (11) 21-month fast pooled from 2 independent experiments. f, Serum FFA in fed and fasted mice. Each symbol represents an individual mouse. Data are pooled from 4 independent experiment and are represented as mean±SEM. n= (23) 4-month fed; (13) 21-month fed; (26) 4-month fasted; (13) 21-month fasted; each symbol represents an individual mouse. g, Body-weight, VAT weight, serum FFA, glycerol and FFA release from VAT explants in 4-month old fed, 12h fast or 24h fasted animals. Data are pooled from 2 independent experiments and are represented as mean±SEM. n= (10) fed, (10) 12h fast and (5) 24h fast; each symbol represents an individual mouse. h, Hsl and Atgl gene expression in floating adipocytes isolated from VAT of 4- (black) or 21-month old (red) mice that were fed or fasted for 24h. Data are represented as mean±SEM. N= (5) 4-month fed; (6) 21-month fed; (6) 4-month fast; (9) 21-month fast pooled from 2 independent experiments. i, Western blot of lipolytic signaling pathway (pHSL, HSL, ATGL) in VAT from 4- or 21-month old mice fed or fasted for 12h. Each lane is an individual animal that received indicated treatment. Actin was probed for as a loading control. Representative of one experiment. j, Western blot of lipolytic signaling pathway (pHSL, HSL, ATGL) in VAT explants from 4- or 21-month old fed mice that were left unstimulated or stimulated with 1uM NE. Each lane represents a biological replicate. Representative of two individual experiments. Actin was probed for as a loading control. In all graphs (a–h), Tukey’s Test was used to identify statistical differences; P value *<0.05, **<0.01, ***<0.001, ****<0.0001
Extended Data Figure 2
Extended Data Figure 2. Age-related changes in ATMs in response to fasting, related to Figure 1
a, Representative gating strategy for ATM analyses. b, Representative contour plots of CD206 and CD11c expression within F4/80+CD11b+ ATMs from VAT of fed or fasted mice. Values represent mean for each condition from 2 individual experiments. Exact Ns are displayed in table 1. c, Quantification of CD11c+CD206 (top) and CD11c+CD206+ (bottom) populations from panel b, expressed as a percentage of total F4/80+ CD11b+ cells. Data are represented as mean±SEM and pooled from two independent experiments. Each symbol represents an independent biological sample pooled from 1–4 mice; exact Ns are displayed in figure and on table 1. Tukey’s Test; P value ***<0.001, ****<0.0001 d, FFA release from 3- or 21- month old fasted VAT explants that were co-cultured with sorted ATMs from 3-month old adipose. Data are represented as mean±SEM. Exact N’s, which are biological replicates, are described in figure and are combined from three individual experiments. Student’s T-Test; P value *<0.05 e, Western blot of MAOA in VAT from 4- or 21-month old mice that were fasted for 24h. Each lane represents an individual animal. A short (5’; top panel) and long (30’; middle panel) exposure are shown for clarity. Actin was probed for as a loading control. Representative of one independent experiment.
Extended data Figure 3
Extended data Figure 3. ATMs are unique tissue-resident macrophage cell type, related to Figure 2
a, Workflow related to Figure 2 and extended data 3. b, PCA based on 13,954 present genes revealing the distribution of samples according to tissue origin and age. c, Heatmap of differentially expressed genes between 24- and 3-month macrophages in whether VAT or spleen using a fold-change <- 1.5 or > 1.5 and an FDR-adjusted p-value < 0.05. Expression values were z-transformed and scaled to a minimum of -2 and a maximum of 2. Rows and columns were ordered based on hierarchical clustering. d, Heatmap of 1000 most variable genes. Expression values were z-transformed and scaled to a minimum of -2 and a maximum of 2. Rows and columns were ordered based on hierarchical clustering. e, PCA based on 13,846 present genes of a combined dataset containing the four murine macrophage populations defined by origin and age and a compendium of murine tissue-resident macrophages of seven different organs (GSE63340).
Extended data Figure 4
Extended data Figure 4. Aged ATMs express distinct transcriptome, related to Figure 2
a, Workflow related to Figure 2 and extended data 4. b, Co-expression networks based on 1,887 variable genes having a correlation of at least 0.98 to at least one other gene. For each condition, the fold-change compared to the overall mean was mapped onto the networks, ranging from blue representing a negative fold-change to red representing a positive fold-change. Circles indicate the sub-clusters, which were identified for each condition. c, Heatmap of lipid metabolism-related genes in VAT and splenic macrophages. Expression values were z-transformed and scaled to a minimum of -1.41 and a maximum of 1.41. Genes were ordered by hierarchical clustering.
Extended data Figure 5
Extended data Figure 5. Myeloid cell changes in aged Nlrp3−/− mice, related to Figure 3
a, Representative contour plots showing CD206 and CD11c expression, gated through F4/80+ CD11b+ cells, from VAT of fasted WT and Nlrp3−/− mice. Values represent mean percentage in that quadrant. Ns are displayed on table 1. b, Quantification of CD11c+CD206 (top) and CD11c+CD206+ (bottom) cells gated through F4/80+ CD11b+ cells from VAT of fasted WT (filled) and Nlrp3−/− (open) mice. Data are expressed as mean±SEM. c, B220MHCII+CD11c+ frequency as percentages of the stromal vascular fraction of WT (filled) and Nlrp3−/− (open) mice at 3- or 24-months of age. Data are expressed as mean±SEM. Ns are displayed in the figure and on table 1. d, Percentages of F4/80+ CD11b+cells in the spleen of WT and Nlrp3−/− mice at 5- or 24-months of age, which were fed (filled) or fasted (fasted) for 24 hours. Data are expressed as mean±SEM. Ns are displayed in the figure and represent individual mice. e, Quantification of CD206 and CD11c expression, based on percentages of F4/80+ CD11b+cells, from spleen of fasted WT (filled) or Nlrp3−/− (open) mice. Data are expressed as mean±SEM. Exact Ns are described with the figure. Tukey’s Test was used to identify significance in all panels. P value *<0.05, **<0.01, ****<0.0001.
Extended data Figure 6
Extended data Figure 6. Nlrp3 regulation of age-induced genes in ATMs, related to Figure 3
a, Workflow for RNA sequencing data analysis in Figure S6. b, (Left) PCA based on 13,129 present genes revealing the distribution of VAT macrophage populations from three different age/genotype groups. (Right) Heatmap of 1000 most variable genes in VAT macrophage populations compared between all three groups. Expression values were z-transformed and scaled to a minimum of -2 and a maximum of 2. Rows and columns were ordered based on hierarchical clustering. c, (Left) PCA based on 13,169 present genes revealing the distribution of splenic macrophage populations from three different age/genotype groups. (Right) Heatmap of 1000 most variable genes in splenic macrophage populations compared between all three groups. Expression values were z-transformed and scaled to a minimum of -2 and a maximum of 2. Rows and columns were ordered based on hierarchical clustering. d,e, Venn Diagrams comparing genes being up- (fold-change > 2, left) or downregulated (fold-change < -2, right) in 24-month compared to 3-month WT macrophages with genes being down- (fold-change <-2, left) or upregulated (fold-change > 2, right) in 24-month Nlrp3−/− compared to 24-month WT macrophages in whether (d) VAT or (e) spleen. f, Heatmaps showing the expression patterns of the top 20- upregulated (left) or downregulated (right) genes (extended data 6e) to be rescued by Nlrp3-deficiency in splenic macrophages. Expression values were z-transformed and scaled to a minimum of -1.15 and a maximum of 1.15. Genes were ranked according to expression in 24-month WT splenic macrophages.
Extended data Figure 7
Extended data Figure 7. Nlrp3 regulation of senescence and lipid associated genes in ATMs and splenic macrophages, related to Figure 3
a, Workflow for Figure 3 and extended data 7. b, Barplot displaying the fold-change between 24- and 3- month WT VAT macrophages (pink) and 24-month Nlrp3−/− and 24-month WT VAT macrophages (turquoise) for senescence-associated genes. Horizontal dashed lines indicate fold-changes of 1.5 and -1.5 respectively. c, Heatmap of lipid metabolism-related genes in VAT macrophages. Expression values were z-transformed and scaled to a minimum of -1.15 and a maximum of 1.15. Genes were ranked according to hierarchical clustering. d, Heatmap of present genes of the spleen macrophage dataset linked to Maoa, Comt, Ald- or Akr- families in splenic macrophages. Expression values were z-transformed and scaled to a minimum of -1.15 and a maximum of 1.15. Rows are in the same order as in Figure 3c and genes which are not present in the spleen dataset are left blank.
Extended data Figure 8
Extended data Figure 8. Mechanism for Gdf3 inhibition of NLRP3 inflammasome activation, related to Figure 4
a, (Left) Pcsk6 mean expression, from RNA seq analysis, from sorted ATMs in 3-month WT, 24-month WT or 24-month Nlrp3−/− VAT. Data are expressed as mean±SEM. Ns are displayed on table 1. (Right) Schematic depicting the interaction between macrophage-PCSK6 and GDF3 and action on adipocyte lipolysis. b, Quantification of pro-caspase-1 (left) and active p20 caspase-1 (right) from panel 4B, normalized to actin, in WT (filled) or Gdf3−/− (empty) BMDMs treated with LPS or LPS+ATP. Data are represented as mean±SEM and show n=3 (WT), 4 (Gdf3−/−) biological replicates. c, Caspase-1 gene expression in LPS-treated BMDMs generated from WT (black) or Gdf3−/− (grey) mice. Data are pooled from 2 independent experiments, each with n=(3) and (2) biological replicates and expressed as mean±SEM. d, Il1β gene expression in LPS-treated BMDMs generated from WT (black) or Gdf3−/− (grey) mice and displayed as fold change to untreated BMDMs. Data are pooled from 3 independent experiments, each with n= (3), (4) and (3) biological replicates and expressed as mean±SEM. e, Immunoblot showing phopho-p65, total p65, and IκB-α expression in LPS-treated WT or Gdf3−/− BMDMs. Representative of one independent experiment. f, Maoa gene expression in WT or Gdf3−/− BMDMs that have left untreated. Data are expressed as mean±SEM and pooled from 2 individual experiments. Each symbol represents a biological replicate. Tukey’s Test (a, b) or Student’s T-Test (c,d,f) was used to test for significance; P value *<0.05, **<0.01, ***<0.0001.
Extended Data Figure 9
Extended Data Figure 9. Schematic to show nerve associated macrophages and role in aged adipose, related to Figure 4
a, Schematic of the mTmG construct before (top) and after (bottom) Cre-mediated recombination in the LysMCre+ myeloid cells. The LysMCre+ mT/mG+ traces the myeloid cells with membrane green fluorescence protein (mG- green), whereas LysMCre mT/mG+ cells lacking cre recombination indelibly express tomato (mT- red). b, Single-color images of merged image from Figure 4e. Use of LysM-Cre: mT/mG reporter mouse plus antibody staining, allowed for visualization of all cells (mTomato-red), myeloid cells (mGFP-green), TH- (blue) and TUBB3- (white) expressing nerves. Representative of 6 independent experiments. c, Schematic representing the model. In young adipose, fasting initiates catecholamine release from sympathetic nerves. Binding of catecholamines on beta-adrenergic receptors (β-AR) causes intracellular cAMP increases, activation of PKA and downstream signaling lipases (ATGL, HSL, MGL) resulting in the hydrolysis of triglyceride and release of fatty acid (FA) and glycerol. Lipolysis and FFA release are necessary fuel elements for survival during starvation, and promoting cold and exercise tolerance. During aging, there is an increase in inflammatory danger-associated-molecular patters (DAMPs), leading to the activation of the NLRP3 inflammasome in adipose tissue macrophages. NLRP3-dependent increases in GDF3 and MAOA result in degradation of norepinephrine (NE), prevent NE-activation of lipolytic signaling in adipocytes and cause reduced FA and glycerol release. Inset: The pathway for MAOA-driven degradation of NE into DOPEGAL, and subsequent breakdown into DHMA and DHPG by ALDs and AKRs is displayed. TG: triglyceride; DG: diglyceride; MG: monoglyceride; ALD: Aldehyde dehydrogenases; AKR: aldo-keto reductases; DOPEGAL: dihydroxyphenylglycolaldehyde; DHPG: dihydroxyphenyl glycol; DHMA: dihydroxymandelic acid
Figure 1
Figure 1. Adipose tissue macrophages drive lipolysis resistance during aging
a,b, Glycerol (top) and FFA (bottom) release from VAT of 4- and 21- month WT mice that were a, fed or fasted for 24 hours (Exact Ns (biological replicates) are listed in the figure; Tukey’s Test; P value **<0.01, ***<0.001, ****<0.0001 or b, stimulated with 1 or 10uM of NE (Exact Ns (biological replicates) are listed in the figure; Tukey’s Test; P value **<0.01, ***<0.001, ****<0.0001). c, Representative dot plots of F4/80+ CD11b+ ATMs gated through CD45+ live cells (Values represent means combined from 2 independent experiments). d, (Top) FFAs released from in vitro-derived adipocytes from 3-month old mice after stimulation with NE ± ATMs isolated from 3- or 24-month mice. (Exact Ns (biological replicates); Tukey’s Test; P value *<0.05) (Bottom) Glycerol released from VAT of fasted 3- or 21- month mice that were co-cultured with ATMs from 3-month mice. (Exact Ns (biological replicates); Student’s T-Test; P value *<0.05). e, Workflow of RNA-Seq data analysis of 3- and 24-month ATMs with heatmap of differentially expressed genes. Barplot displays (in %) 2,806 variable genes, which are part of the corresponding GO term, and have higher expression in 24-month or 3-month ATMs (bottom). f, Scatterplot of catecholamine degradation enzymes, comparing the log2-expression values of 3- and 24-month in ATMs. (Inset) Schematic depicting NE degradation by enzymes. Graphs show mean±s.e.m. Exact Ns (biological replicates) are listed within the figure (a, b, d), and listed in table 1 for pooled values (c, e, f).
Figure 2
Figure 2. Nlrp3 inflammasome activation is required for lipolysis resistance
a, Relative fractions of 29 different human in vitro-activated macrophage gene signatures in the 3- and 24-month macrophages from VAT and spleen. Black box indicates the largest enrichment signature for that condition. b, Heatmaps of differentially expressed genes associated with NOD-like receptor signaling pathway in 3- and 24-month ATMs (V(3), V(24)) and splenic macrophages (S(3), S(24)). Expression values were z-transformed and scaled as indicated. c, Glycerol release from 3-month VAT explants co-cultured with NLRP3-activated BMDMs (Exact Ns (biological replicates) are listed in the figure; Student’s T-Test; P value *<0.05). d, Glycerol release from 3-month VAT explants co-cultured with WT (filled) or Nlrp3−/− (open) BMDMs that were left untreated (circles) or treated (squares) with LPS and ATP to activate the inflammasome (Exact Ns (biological replicates) are listed in the figure; Tukey’s Test; P value **<0.01, ****<0.0001). All conditions received 1uM NE to stimulate lipolysis. e, Glycerol release from VAT of WT or Nlrp3−/− mice at 5- or 24-months after 24hour feeding or fasting. (Exact Ns (biological replicates) are listed in the figure; Tukey’s Test; P value **<0.01). Graphs are presented as mean±SEM. Exact Ns are listed within the figure (c,d,e), and listed in table 1 for pooled values (a,b).
Figure 3
Figure 3. Nlrp3 inflammasome regulates catecholamine degradation genes in aged ATMs
a, Percentage of macrophages from VAT or spleen of WT or Nlrp3−/− mice, expressed as mean±SEM. (Tukey’s Test; P value *<0.05, **<0.005) b, Heatmaps showing the expression patterns of the top 20 genes upregulated (left) or downregulated (right) with age and rescued by Nlrp3-deficiency in ATMs. c, Heatmap of catecholamine degradation enzymes, Maoa, Comt and genes belonging to the aldo-keto reductases or aldehyde dehydrogenases gene families in ATMs. Genes were ranked according to decreasing expression in 24-month WT ATMs. Arrowheads indicate NE-catabolizing genes: Maoa and Comt. Expression values were z-transformed and scaled. Exact Ns (biological replicates) are listed within the figure and further described in table 1; data are from one independent experiment.
Figure 4
Figure 4. GDF3 dependent increased Maoa expression impairs lipolysis in aging
a, Glycerol release from unstimulated VAT from WT or Gdf3−/− mice at 3-months (Exact Ns (biological replicates) are listed in the figure; Student’s T-Test; P value *<0.05). b, Immunoblot showing caspase-1 expression in WT or Gdf3−/− BMDMs treated with LPS or LPS+ATP, with actin as a loading control. Representative of one independent experiment. c, Glycerol release from 3-month old VAT explants exposed to NE and co-cultured with WT (black) or Gdf3−/− (white) BMDMs treated to induce NLRP3 activation (Exact Ns (biological replicates) are listed in the figure; Student’s T-Test; P value *<0.05). d, RT-PCR of Maoa gene in NLRP3 activated- WT or Gdf3−/− BMDMs (Exact Ns (biological replicates) are listed in the figure; Student’s T-Test; P value **<0.01). e, Nerve-associated macrophages visualized by whole-mount confocal microscopy of VAT. LysM-Cre: mT/mG reporter mouse plus antibody staining visualizes all cells (mTomato-red), myeloid cells (mGFP-green), TH- (blue) and TUBB3- (white) expressing nerves. Representative of 6 independent experiments. f, FFA release from 3-month WT VAT co-cultured with BMDMs that were left untreated or pre-activated with LPS+ATP with or without 10uM clorgyline (MAOA-inhibitor). NE (1uM) was used to stimulate lipolysis, (Exact Ns (biological replicates) are listed in the figure; Student’s T-Test; P value *<0.05). g, Glycerol (mM/g tissue) release, expressed as fold change to 3-month VAT(Exact Ns (biological replicates) are listed in the figure; Tukey’s Test; P value *<0.05, **<0.01), h, western blot of pHSL-S563, pHSL-S660, HSL, ATGL (representative of two independent experiments) i, or UCP1 (representative of one experiment) and j, HPLC quantification of NE (ng/g VAT) from 3-or 22-month old mice given i.p. injection of 2mg/kg clorgyline and fasted for 24h (Exact Ns (biological replicates) are listed in the figure; Tukey’s Test; P value *<0.05). Each lane or symbol represents an individual animal; graphs are presented as mean±SEM. Exact Ns are listed within the figure (a,c,d,f,g,j).

Comment in

References

    1. Young SG, Zechner R. Biochemistry and pathophysiology of intravascular and intracellular lipolysis. Genes Dev. 2013;27:459–484. doi: 10.1101/gad.209296.112. - DOI - PMC - PubMed
    1. Lonnqvist F, Nyberg B, Wahrenberg H, Arner P. Catecholamine-induced lipolysis in adipose tissue of the elderly. The Journal of clinical investigation. 1990;85:1614–1621. doi: 10.1172/JCI114612. - DOI - PMC - PubMed
    1. James RC, Burns TW, Chase GR. Lipolysis of human adipose tissue cells: influence of donor factors. J Lab Clin Med. 1971;77:254–266. - PubMed
    1. Gerber JG, Detmar-Hanna D, Zahniser NR. Lack of an effect of age on beta-adrenoceptor-mediated lipolysis in isolated human adipocytes. The journals of gerontology. Series A, Biological sciences and medical sciences. 1999;54:B71–77. - PubMed
    1. Feingold KR, Doerrler W, Dinarello CA, Fiers W, Grunfeld C. Stimulation of lipolysis in cultured fat cells by tumor necrosis factor, interleukin-1, and the interferons is blocked by inhibition of prostaglandin synthesis. Endocrinology. 1992;130:10–16. doi: 10.1210/endo.130.1.1370149. - DOI - PubMed

Publication types

MeSH terms