. 2017 Oct 5;550(7674):67-73.
doi: 10.1038/nature24033. Epub 2017 Sep 20.

Genome editing reveals a role for OCT4 in human embryogenesis

Affiliations

Genome editing reveals a role for OCT4 in human embryogenesis

Norah M E Fogarty et al. Nature. .

Erratum in

  • Erratum: Genome editing reveals a role for OCT4 in human embryogenesis.
    Fogarty NME, McCarthy A, Snijders KE, Powell BE, Kubikova N, Blakeley P, Lea R, Elder K, Wamaitha SE, Kim D, Maciulyte V, Kleinjung J, Kim JS, Wells D, Vallier L, Bertero A, Turner JMA, Niakan KK. Fogarty NME, et al. Nature. 2017 Nov 9;551(7679):256. doi: 10.1038/nature24292. Epub 2017 Oct 4. Nature. 2017. PMID: 28976971

Abstract

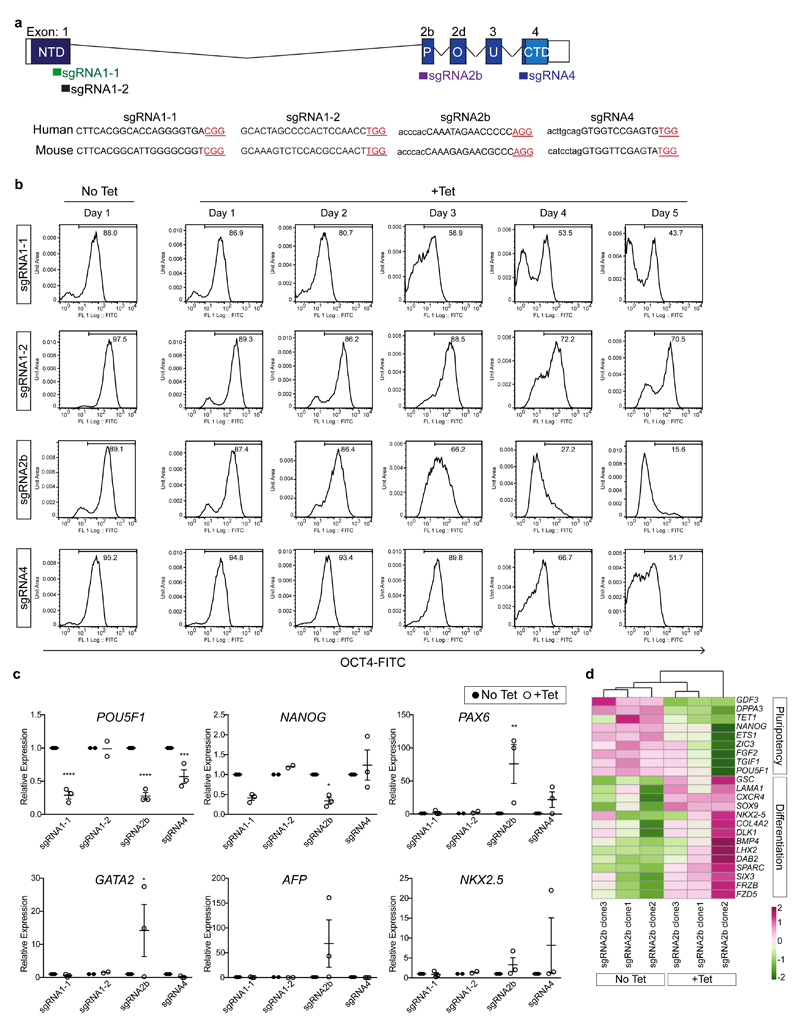
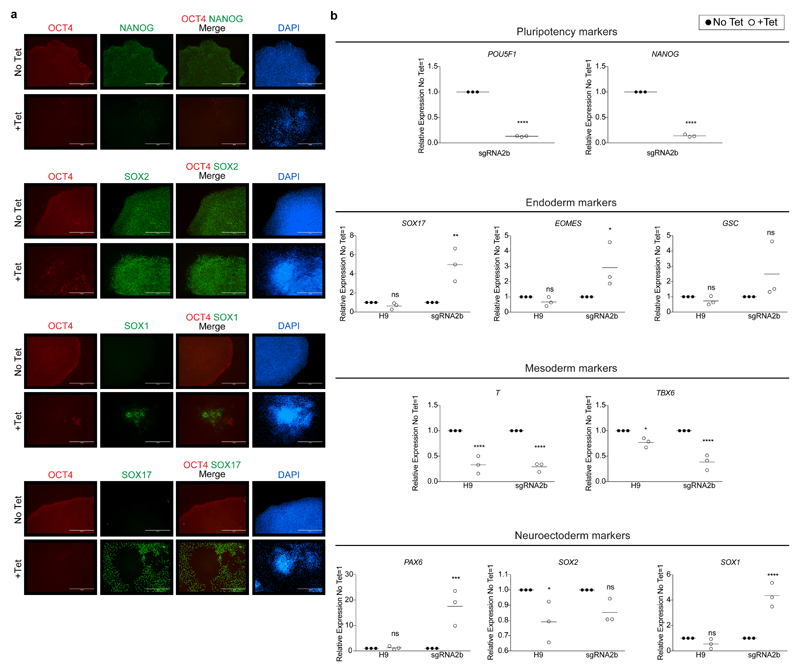
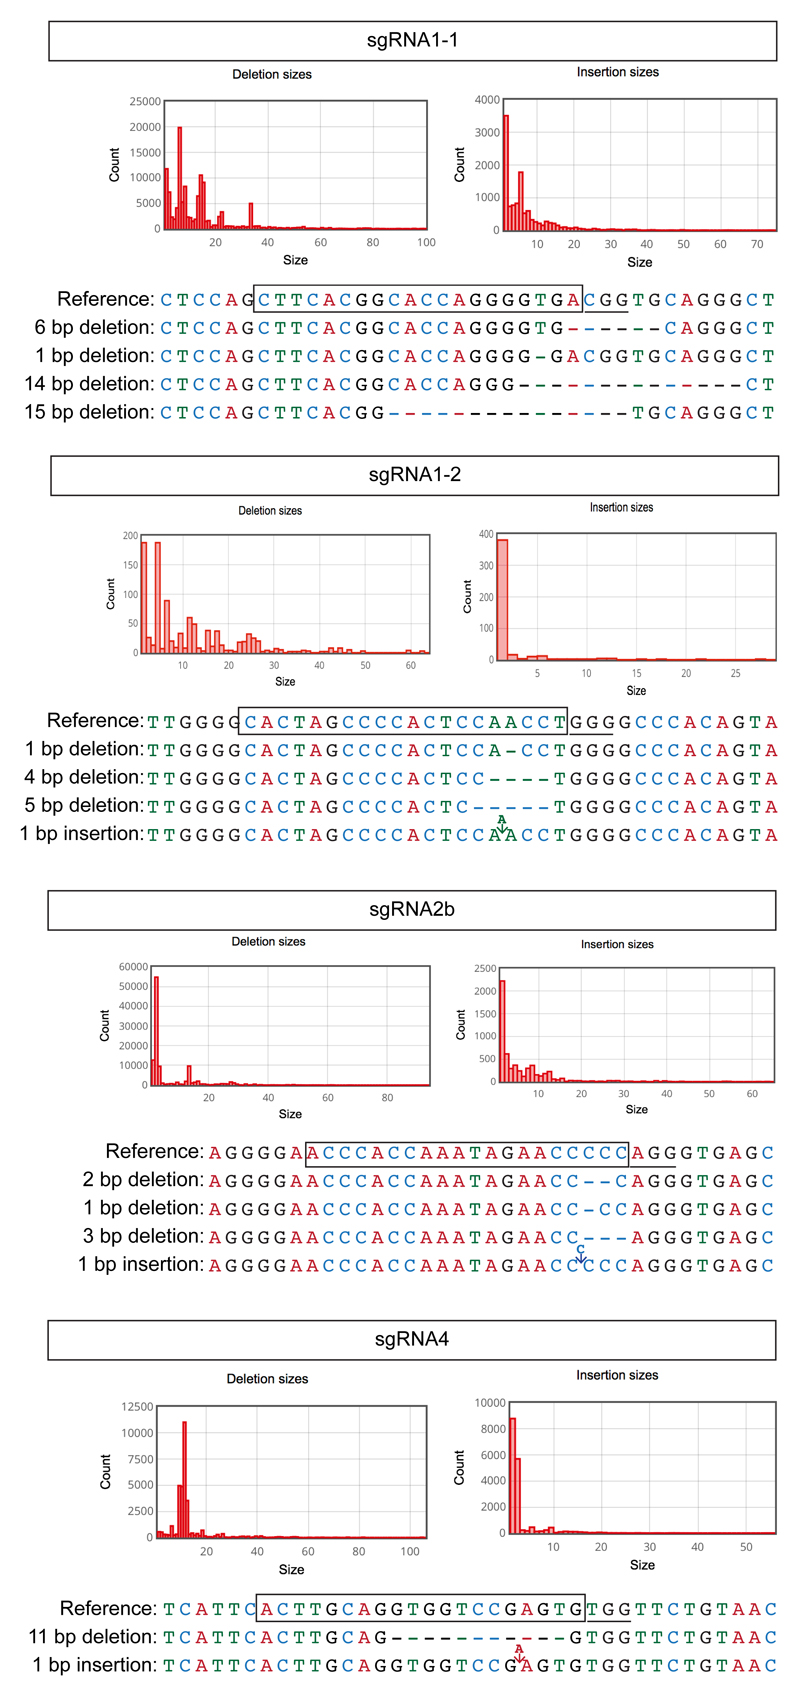
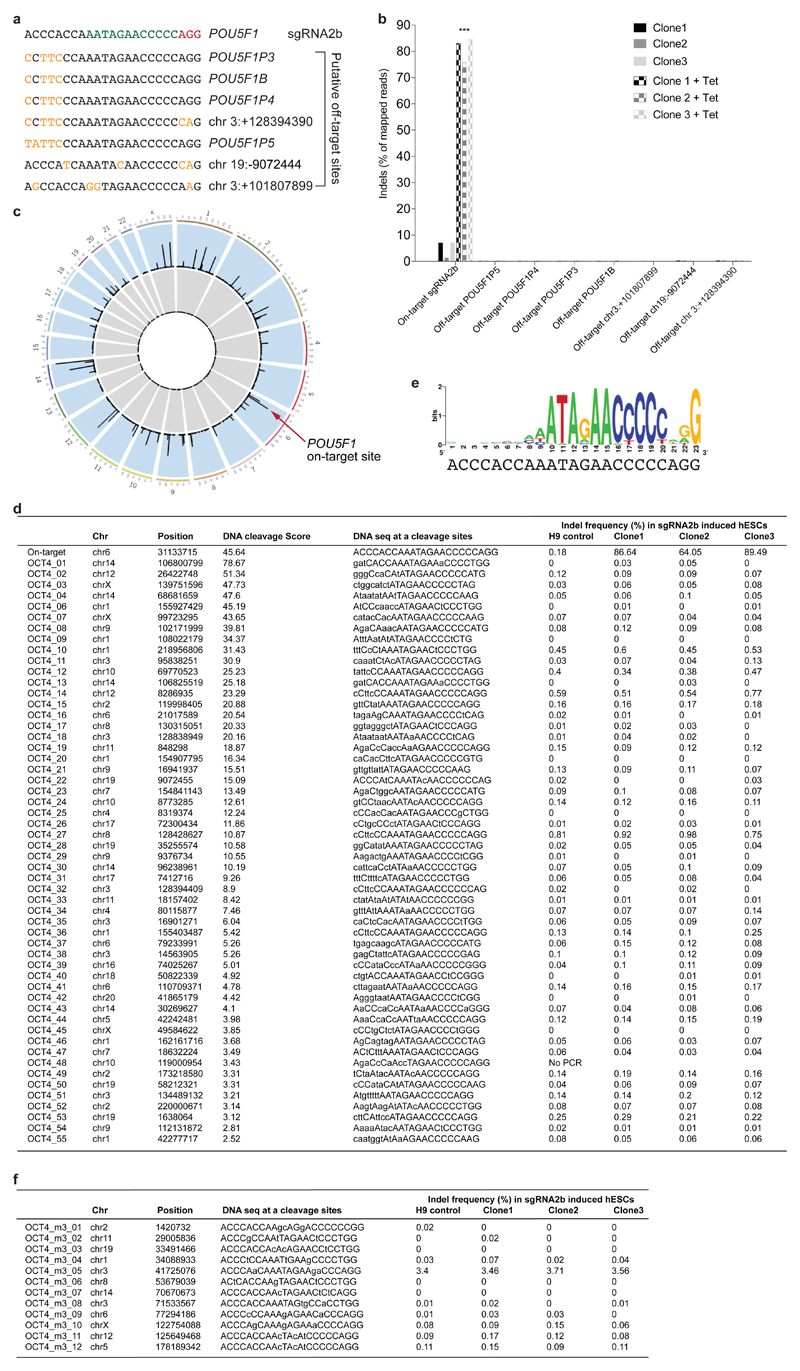
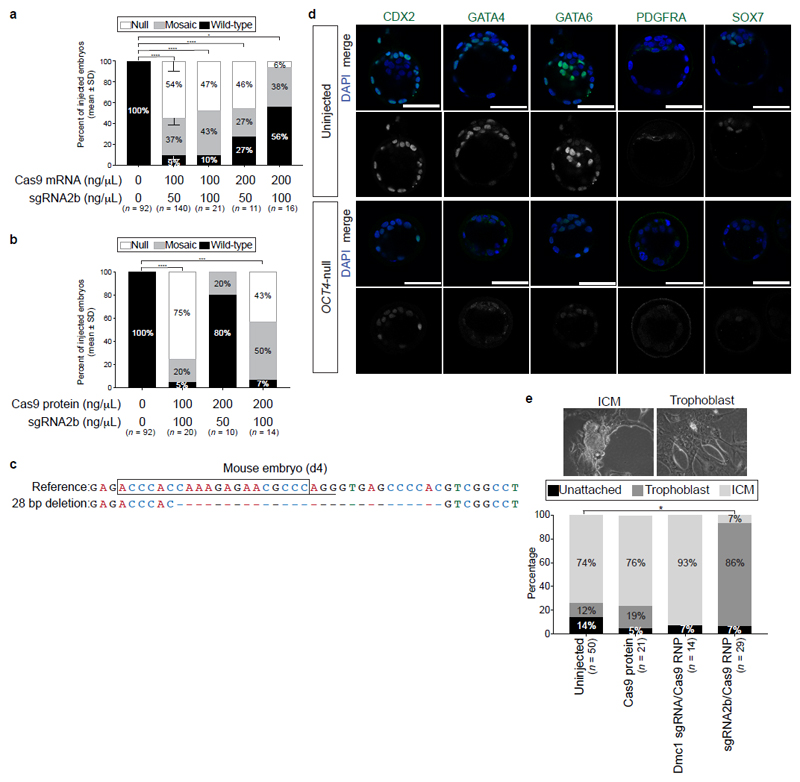
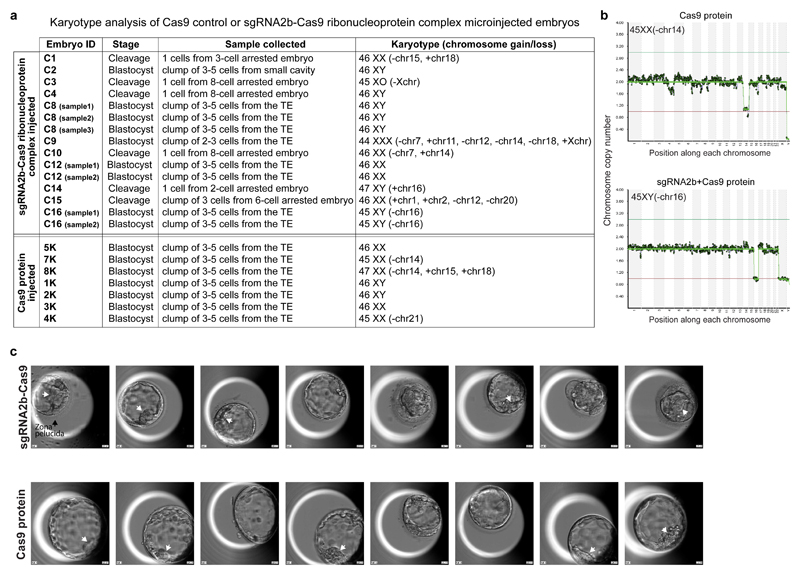
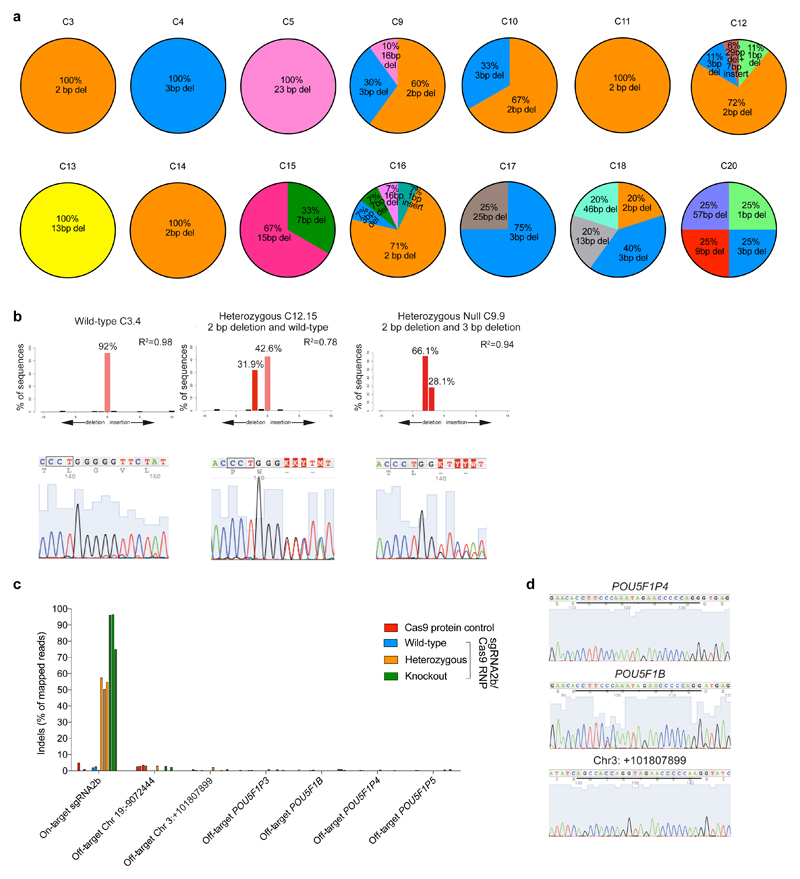
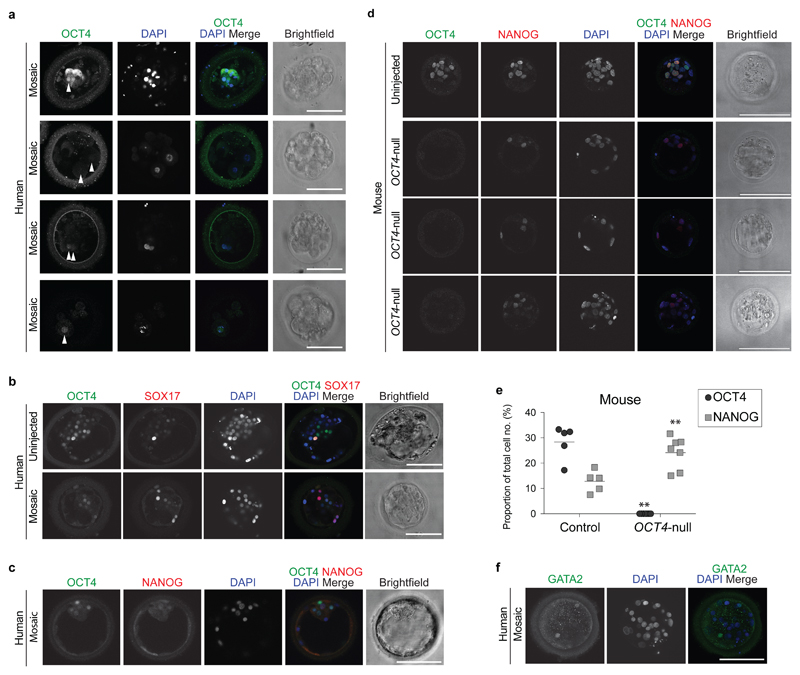
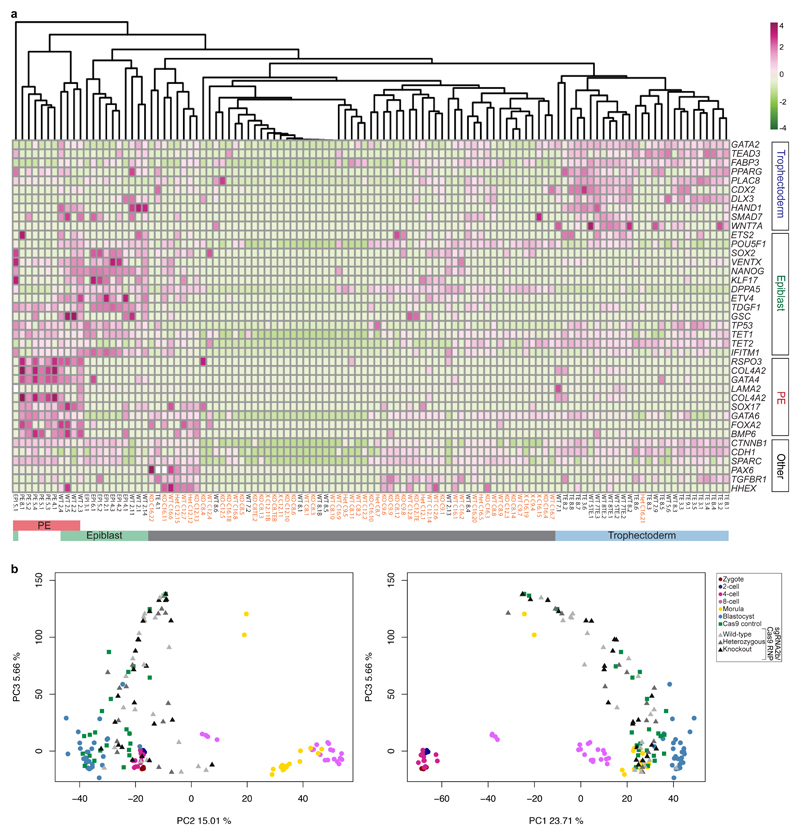
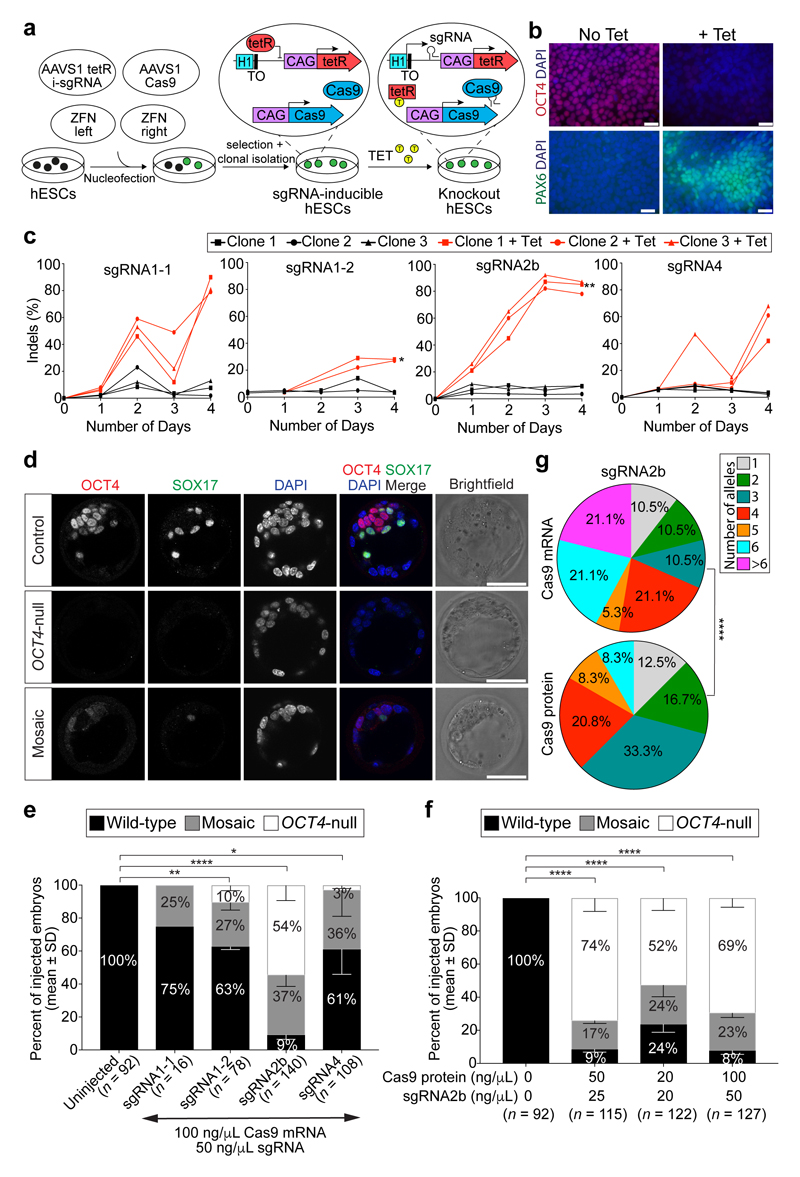
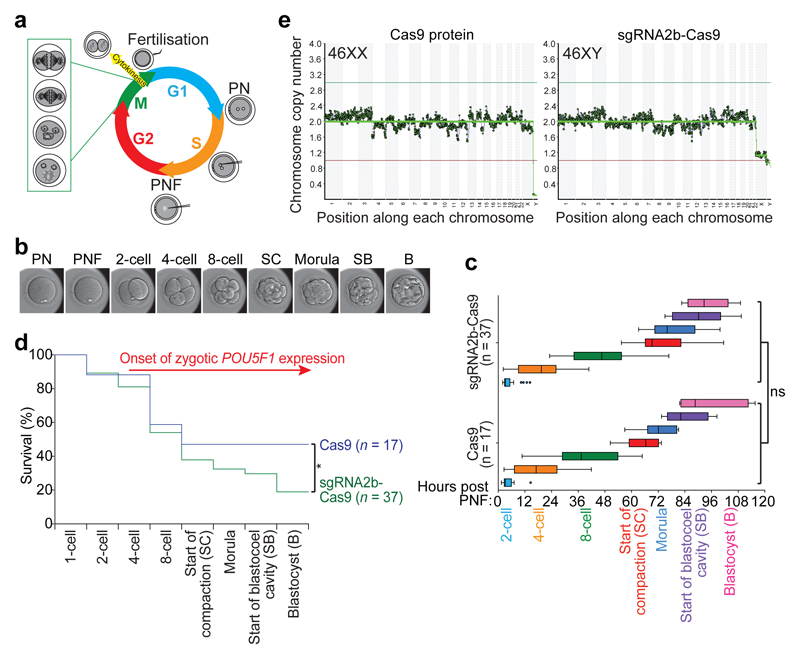
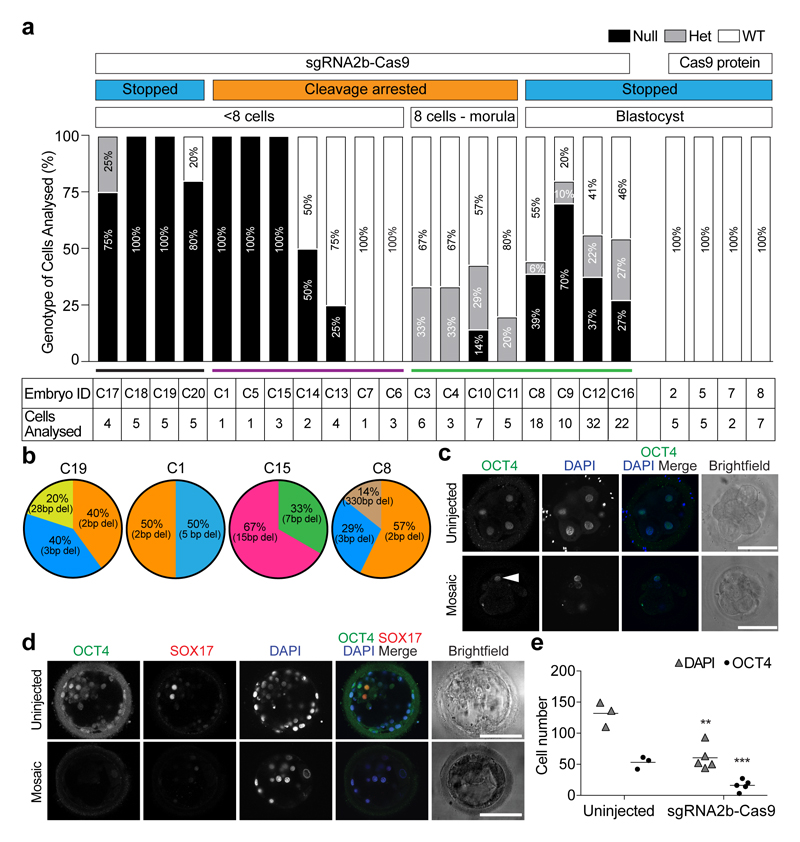
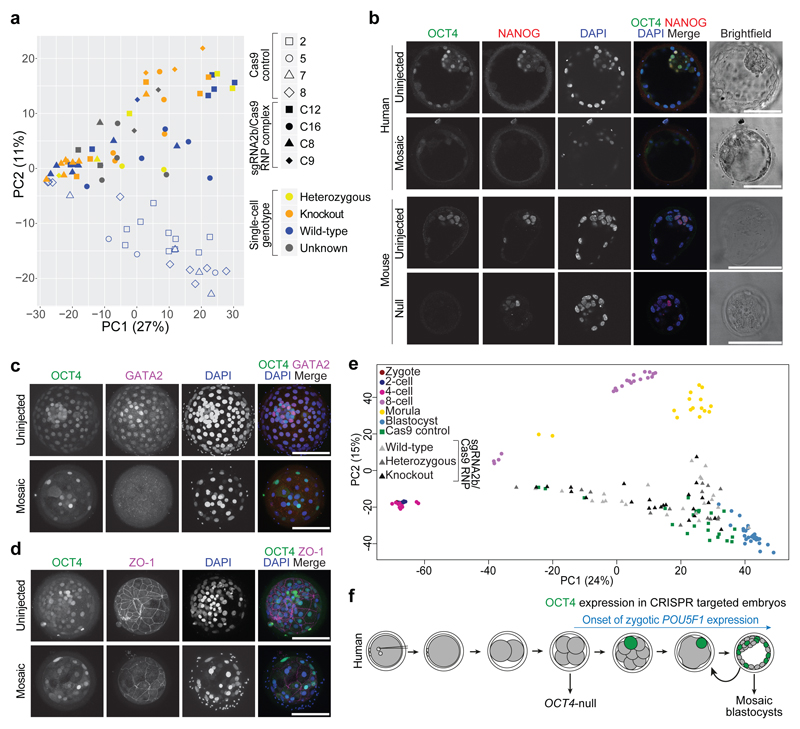
Despite their fundamental biological and clinical importance, the molecular mechanisms that regulate the first cell fate decisions in the human embryo are not well understood. Here we use CRISPR-Cas9-mediated genome editing to investigate the function of the pluripotency transcription factor OCT4 during human embryogenesis. We identified an efficient OCT4-targeting guide RNA using an inducible human embryonic stem cell-based system and microinjection of mouse zygotes. Using these refined methods, we efficiently and specifically targeted the gene encoding OCT4 (POU5F1) in diploid human zygotes and found that blastocyst development was compromised. Transcriptomics analysis revealed that, in POU5F1-null cells, gene expression was downregulated not only for extra-embryonic trophectoderm genes, such as CDX2, but also for regulators of the pluripotent epiblast, including NANOG. By contrast, Pou5f1-null mouse embryos maintained the expression of orthologous genes, and blastocyst development was established, but maintenance was compromised. We conclude that CRISPR-Cas9-mediated genome editing is a powerful method for investigating gene function in the context of human development.


Conflict of interest statement

The authors declare competing financial interests: details are available in the online version of the paper.

Figures

Extended Data Figure 1
Extended Data Figure 1. POU5F1 targeting and comparison of sgRNAs.
a, Schematic representation of the human POU5F1 locus and sgRNA targeting sites. The location (not to scale) and sequences of the sgRNAs tested are shown and the PAM sequences are underlined and in red font. Sequences within the exons are in uppercase and introns are in lowercase. The mouse sgRNA sequences are shown below. The exons encoding the N-terminal domain (NTD), POU DNA-binding domain or the C-terminal domain (CTD) are indicated. b, Representative flow cytometry analysis quantifying OCT4 expression in human ES cells induced to express each sgRNA over 5 days compared to uninduced controls. The percentage of OCT4 protein expression is shown. c, qRT–PCR analysis after 4 days of sgRNA induction in mTeSR medium. Relative expression reflected as fold difference over uninduced cells normalized to GAPDH. Data points and mean for all samples are shown: n = 2 sgRNA1-1 clones; n = 3, sgRNA 1-2, 2b or 4 clones, representative of two independent experiments and ± s.e.m. where there are three samples. Two-way ANOVA; *P < 0.05; **P < 0.01; ***P < 0.001; ****P < 0.0001. d, Heat maps of selected genes showing unsupervised hierarchical clustering of uninduced and sgRNA2b-induced human ES cells. Normalized RNA-seq expression levels are plotted on a high-to-low scale (purple–white–green).
Extended Data Figure 2
Extended Data Figure 2. Further characterization of sgRNA2b-induced human ES cells.
a, Human ES cells induced to express sgRNA2b for 4 days (+Tet) in chemically defined medium with activin A and FGF2 (CDM/AF) compared to uninduced controls (No Tet). Immunofluorescence analysis for the pluripotency markers OCT4, NANOG and SOX2 or markers associated with differentiation to early derivatives of the germ layers (SOX1-expressing ectoderm cells or SOX17-expressing endoderm cells). DAPI nuclear staining (blue) is shown. Scale bar, 400 μm. b, qRT–PCR analysis for selected genes associated with either pluripotency or differentiation to derivatives of the germ layers in human ES cells induced to express each of the sgRNAs for 4 days. Relative expression reflected as fold difference over wild-type human ES cells and normalized to PBGD. Data points and mean ± s.e.m. are shown: n = 3 wild-type H9 and sgRNA2b, representative of two independent experiments. Two-way ANOVA; *P < 0.05; **P < 0.01; ***P < 0.001; ****P < 0.0001, ns, not significant.
Extended Data Figure 3
Extended Data Figure 3. On-target mutation spectrum in human ES cells induced to express sgRNA1-1, sgRNA1-2, sgRNA2b or sgRNA4.
Shown are frequent types of indel mutations and corresponding sequences observed in human ES cells induced to express sgRNA1-1, sgRNA1-2, sgRNA2b or sgRNA4. The cells were induced to express each sgRNA for 4 days and the data shown are representative of the types of indel mutations observed in other clonal lines (n = 2 sgRNA1-1 clones; n = 3, sgRNA 1-2, 2b or 4 clones) and across time (from 1 to 4 days following induction of each sgRNA).
Extended Data Figure 4
Extended Data Figure 4. Off-target analysis of sgRNA2b-induced human ES cells.
a, The POU5F1 sgRNA2b 12-bp seed sequence is highlighted in green and the NGG PAM sequence in red. In black are the nucleotide sequences 5′ to the sgRNA seed sequence. Seven putative off-target sequences and associated genes are shown including POU5F1 pseudogenes. In orange are the nucleotides that differ from the sgRNA2b sequence. b, Percentage of indel mutations detected at putative off-target sites in human ES cells 4 days after tetracycline induction of sgRNA2b compared to uninduced controls. Data are percentages of indel mutations detected by targeted deep sequencing in the cell lines at each of the sites indicated. Comparisons made between three clonal human ES cell lines induced to express sgRNA2b versus uninduced controls. The percentage of indel mutations induced at the on-target site were significantly different while all other sites were not significantly different. Two-way ANOVA. ***P < 0.001. c, Digenome-seq results displayed as a genome-wide circos plot. The height of the peak corresponds to the DNA cleavage score. The red arrow points to the POU5F1 locus on chromosome 6. d, Percentage of indel mutations observed in sgRNA2b-induced human ES cells and in wild-type H9 control cells at each locus following targeted deep sequencing of putative off-target sites identified by Digenome-seq. e, Off-target candidate nucleotides displayed as sequence logos using the WebLogo program. f, Percentage of indel mutations observed in sgRNA2b-induced human ES cells and in wild-type H9 control cells following targeted deep sequencing of putative off-target sites determined by WebLogo sequence homology.
Extended Data Figure 5
Extended Data Figure 5. Assessing a range of Cas9 and sgRNA combinations for microinjection into mouse pronuclear zygotes.
a, b, Additional conditions were tested in mouse embryos microinjected with the sgRNA2b either with Cas9 mRNA (a) or as a complex with the Cas9 protein (b) at the ratios indicated. Quantification was performed on the proportion of mouse embryos at the blastocyst stage that are phenotypically null (loss of OCT4 and SOX17 protein expression), mosaic or heterozygous (partial OCT4 and/or SOX17 expression) or uninjected (strong OCT4 and SOX17 expression). Data are mean ± s.d. from three independent experiments. Comparisons were made between the percentage of OCT4-null embryos observed versus wild-type uninjected control embryos. Chi-squared test. *P < 0.05; ***P < 0.001; ****P < 0.0001. c, The types of indel mutations detected in mouse embryos microinjected with the sgRNA2b–Cas9 complex. The sgRNA sequence is boxed and the NGG PAM site underlined. Dash, deletion position. d, Further characterization of mouse embryos microinjected with sgRNA2b–Cas9 compared to uninjected control blastocysts. Immunofluorescence analysis for markers of the trophectoderm (CDX2) or primitive endoderm (GATA4, GATA6, PDGFRA and SOX7) lineages together with DAPI nuclear staining. Confocal z-section. Scale bar, 100 μm. e, Quantification of blastocyst inner cell mass (ICM) or trophoblast outgrowths in mouse embryonic stem cell derivation conditions. Uninjected, Cas9-injected or Cas9 plus Dmc1 sgRNA-injected cells (targeting a gene not essential for preimplantation development) were used as controls. Comparisons were made between the percentage of ICM outgrowths observed in blastocysts that developed following sgRNA2b–Cas9 microinjection. Two-tailed t-test. *P < 0.05.
Extended Data Figure 6
Extended Data Figure 6. Further assessing human embryo quality.
a, Karyotype analysis following whole-genome sequencing of either single blastomeres, a clump of 3 cells from a cleavage stage embryo or a clump of 3-5 cells from trophectoderm biopsies. Multiple biopies were analysed from embryos C8, C12 and C16. Analysis was also performed on blastocysts that developed following microinjection of Cas9 protein. The type of chromosome gains and losses are indicated. b, Representative karyotype analysis by whole-genome sequencing of human blastocysts. A representative graph indicating aneuploidy in embryos following Cas9 protein and sgRNA2b–Cas9 ribonucleoprotein complex microinjection. c, Phase-contrast images of starting blastocysts and blastocysts that developed following microinjection of the sgRNA2b–Cas9 complex compared to Cas9 protein-injected controls. White arrows point to the presumptive inner cell mass and a black arrow to a representative zona pellucida.
Extended Data Figure 7
Extended Data Figure 7. Evaluating on-target and putative off-target mutations in human embryo cells.
a, The type and relative proportion of indel mutations observed compared to all observable indel mutations within each human embryo. b, Quantification of indels by TIDE analysis. Representative plots and Sanger sequencing chromatograms are shown from OCT4-null, heterozygous and wild-type human cells. c, Percentage of indel mutations detected at the sgRNA2b on-target site and putative off-target sites in single cells microdissected from Cas9 protein-microinjected control blastocysts or blastocysts that developed following sgRNA2b–Cas9 complex microinjection. Putative off-target sites were evaluated in cells that were previously determined to be OCT4-null (green), heterozygous (orange) or wild-type (blue) along with samples from Cas9 protein-microinjected embryos (red). Three representative examples of wild-type and edited cells are shown. d, Sanger sequencing chromatograms from OCT4-null single cells collected from human blastocysts that developed following sgRNA2b–Cas9 microinjection. The chromatograms exemplify the sequence detected in all of the other samples analysed. Underlined is the sequence of the putative off-target site.
Extended Data Figure 8
Extended Data Figure 8. Phenotypic characterization of OCT4-targeted embryos.
a, Immunofluorescence analysis for OCT4 (green) and DAPI nuclear staining (blue) in human cleavage stage embryos following sgRNA2b–Cas9 complex microinjection (n = 5). Confocal z-section. Arrow, OCT4-expressing cell. Scale bar, 100 μm. b, Immunofluorescence analysis for OCT4 (green), SOX17 (red) and DAPI nuclear staining (blue) in an uninjected control blastocyst (n = 3) or a human blastocyst that developed following sgRNA2b–Cas9 complex microinjection (n = 3). Confocal z-section. Scale bar, 100 μm. c, d, Immunofluorescence analysis for OCT4 (green), NANOG (red) and DAPI nuclear staining (blue) in a human blastocyst that developed following sgRNA2b–Cas9 complex microinjection (c, n = 3) or in a mouse uninjected control blastocyst or in blastocysts that developed following sgRNA2b–Cas9 complex microinjection (d, n = 7). Confocal z-section. Scale bar, 100 μm. e, Quantification of NANOG and OCT4 expression in mouse uninjected control blastocysts (n = 5) or in blastocysts that developed following sgRNA2b–Cas9 complex microinjection (n = 7). One-tailed t-test. **P < 0.01. f, Immunofluorescence analysis for GATA2 (green) and DAPI nuclear staining (blue) in a human blastocyst that developed following sgRNA2b–Cas9 complex microinjection (n = 3). Confocal projection. Scale bar, 100 μm.
Extended Data Figure 9
Extended Data Figure 9. Transcriptome analysis of OCT4-targeted embryos.
a, Hierarchical clustering and heat map of a selection of genes following single-cell RNA-seq analysis of human embryos. Embryos C8, C9, C12 and C16 (samples denoted in orange font) were targeted with the sgRNA2b–Cas9 complex. Embryos 2, 5, 7 and 8 were microinjected with Cas9 protein as a control. An uninjected control reference data set labelled PE (primitive endoderm cells), EPI (epiblast cells) or TE (trophectoderm cells) is included. Control cells clustered according to lineage and are indicated with the coloured bars: red, primitive endoderm; green, epiblast; and blue, trophectoderm. Grey bar highlights the samples that have low expression of markers of each of the lineages shown. The genotypes of the samples are noted as POU5F1 wild-type (WT), heterozygous (Het) or knockout (KO). Five samples failed repeated genotyping but the RNA quality is good and these are listed as X. Normalized expression levels are plotted on a high–low scale (purple–white–green). b, c, Principal component analysis of a previously published human single-cell RNA-seq data set integrated with the data from the Cas9 protein control and the sgRNA2b–Cas9 ribonucleoprotein (RNP) complex-microinjected embryos. Each point represents a single cell. Data were plotted along the second and third (b) or the first and third (c) principal components.
Figure 1
Figure 1. Screening sgRNAs targeting OCT4 in optimized inducible CRISPR–Cas9 knockout human ES cells and mouse embryos.
a, Schematic of the strategy used to induce sgRNA expression in human ES cells. The CAG promoter drives constitutive expression of the Cas9 gene as well as the tetracycline-responsive repressor (tetR). The inducible H1-TO promoter drives expression of each sgRNA in the presence of tetracycline (TET). The two transgenic cassettes are each targeted to one of the AAVS1 genomic safe harbour loci using zinc-finger nucleases (ZFN). TO, tetracycline-responsive operator. b, Immunofluorescence analysis of OCT4 (red) or PAX6 (green) and DAPI nuclear staining (blue) expression in human ES cells after 4 days of sgRNA2b induction (+Tet) or in uninduced (No Tet) control human ES cells. Scale bars, 100 μm. c, Quantification of indel mutations detected at each sgRNA on-target site after 4 days of sgRNA2b induction (+Tet). n = 2 (sgRNA1-1 clones); n = 3 (sgRNA1-2, sgRNA2b or sgRNA4 clones). One-way ANOVA compared to uninduced human ES cells. d, Immunofluorescence analysis for OCT4 (red), SOX17 (green) and DAPI nuclear staining (blue) in control, OCT4-null or mosaic mouse blastocysts 4 days after zygote microinjection. Panels that show individual proteins are in grey;, coloured labels relate to merged panels only. Scale bar, 100 μm. e, Quantification of proportions of OCT4-null, mosaic or wild-type mouse blastocysts following microinjection of Cas9 mRNA plus sgRNA1-1, sgRNA1-2, sgRNA2b or sgRNA4, or uninjected controls. Chi-squared test. Data are mean ± s.d. f, Quantification of proportions of OCT4-null, mosaic or wild-type mouse blastocysts following microinjection of the sgRNA2b–Cas9 ribonucleoprotein complex at concentrations indicated. Chi-squared test. Data are mean ± s.d. g, Comparison of mutation spectrums after targeting mouse embryos with sgRNA2b plus Cas9 mRNA or protein. Data are the proportions of unique indels observed. Chi-squared test. *P < 0.05; **P < 0.01; ****P < 0.0001.
Figure 2
Figure 2. The developmental potential of human embryos following CRISPR–Cas9-mediated genome editing.
a, Schematic of the first cell division in human embryos and time of microinjection. PN, pronuclei; PNF, pronuclear fading. b, Representative human embryo at each developmental stage analysed. B, blastocyst; SB, start of blastocyst formation; SC, start of cavitation). c, Morphokinetic analysis of human development after microinjection. Non-parametric two-tailed Kolmogorov–Smirnov test; NS, not significant. d, Kaplan–Meier survival curve of human embryos following microinjection of Cas9 protein or sgRNA2b–Cas9 ribonucleoprotein complex. Zygotic POU5F1 expression is initiated between the four- and eight-cell stages. Chi-squared test comparing the survival trend across time. *P < 0.05. e, Karyotype analysis by whole-genome sequencing of human blastocysts following microinjection of Cas9 protein or sgRNA2b–Cas9 ribonucleoprotein complex. Representative euploid embryos are shown.
Figure 3
Figure 3. Genotypic characterization of OCT4-targeted human embryos.
a, Proportion of POU5F1-null, heterozygous or wild-type cells in each human embryo. The number of separate individual cells analysed is indicated. Embryos 2, 5, 7 and 8 were microinjected with Cas9 protein as a control. All other embryos were microinjected with the sgRNA2b–Cas9 ribonucleoprotein complex. The development of some embryos was stopped and they were removed from culture for analysis, while others were analysed following cleavage arrest. b, The types and relative proportions of indel mutations observed compared to all observable indel mutations within each human embryo. c, Immunofluorescence analysis for OCT4 (green) and DAPI nuclear staining (blue) in an uninjected control cleavage stage human embryo or an embryo that developed following sgRNA2b–Cas9 microinjection (n = 5). Confocal z-section. Arrowhead, OCT4-expressing cell. Scale bar, 100 μm. d, Immunofluorescence analysis for OCT4 (green), SOX17 (red) and DAPI nuclear staining (blue) in an uninjected control human blastocyst (n = 3) or a blastocyst that developed following sgRNA2b–Cas9 microinjection (n = 3). Confocal z-section. Scale bar, 100 μm. e, Quantification of the number of DAPI- or OCT4-positive nuclei in uninjected control human blastocysts (n = 3) compared to blastocysts that developed following sgRNA2b–Cas9 microinjection (n = 5). One-tailed t-test. **P < 0.01; ***P < 0.001.
Figure 4
Figure 4. Phenotypic characterization of OCT4-targeted human embryos.
a, Principal component analysis of single-cell RNA-seq data showing comparisons between the cells from human blastocysts that developed following microinjection of the sgRNA2b–Cas9 ribonucleoprotein complex (filled shapes) and Cas9-microinjected controls (unfilled shapes). The genotype of each cell is distinguished by colour. Five samples failed repeated genotyping but the RNA quality is good and these are listed as Unknown. Each data point represents a single cell. b, Immunofluorescence analysis for OCT4 (green), NANOG (red) and DAPI nuclear staining (blue) in a human or a mouse uninjected control blastocyst or blastocyst that developed after sgRNA2b–Cas9 microinjection (mouse: n = 7; human: n = 3). Confocal z-section. Scale bar, 100 μm. c, Immunofluorescence analysis for OCT4 (green), GATA2 (magenta) and DAPI nuclear staining (blue) in an uninjected control human blastocyst (n = 3) or in a blastocyst that developed following sgRNA2b–Cas9 microinjection (n = 3). Confocal projection. Scale bar, 100 μm. d, Immunofluorescence analysis for OCT4 (green), ZO-1 (magenta) and DAPI nuclear staining (blue) in an uninjected control human blastocyst (n = 2) or in a blastocyst that developed following sgRNA2b–Cas9 microinjection (n = 2). Confocal projection. Scale bar, 100 μm. e, Principal component analysis of a previously published human single-cell RNA-seq data set integrated with data from embryos microinjected with Cas9 protein or the sgRNA2b–Cas9 complex. Each point represents a single cell. f, Diagram summarizing the observations made in the study and their relationship to the onset of zygotic POU5F1 expression.

Comment in

References

    1. Chen AE, et al. Optimal timing of inner cell mass isolation increases the efficiency of human embryonic stem cell derivation and allows generation of sibling cell lines. Cell Stem Cell. 2009;4:103–106. - PMC - PubMed
    1. Niakan KK, Eggan K. Analysis of human embryos from zygote to blastocyst reveals distinct gene expression patterns relative to the mouse. Dev Biol. 2013;375:54–64. - PubMed
    1. Blakeley P, et al. Defining the three cell lineages of the human blastocyst by single-cell RNA-seq. Development. 2015;142:3613. - PMC - PubMed
    1. Jinek M, et al. A programmable dual-RNA-guided DNA endonuclease in adaptive bacterial immunity. Science. 2012;337:816–821. - PMC - PubMed
    1. Kang X, et al. Introducing precise genetic modifications into human 3PN embryos by CRISPR/Cas-mediated genome editing. J Assist Reprod Genet. 2016;33:581–588. - PMC - PubMed

Publication types

MeSH terms

Substances